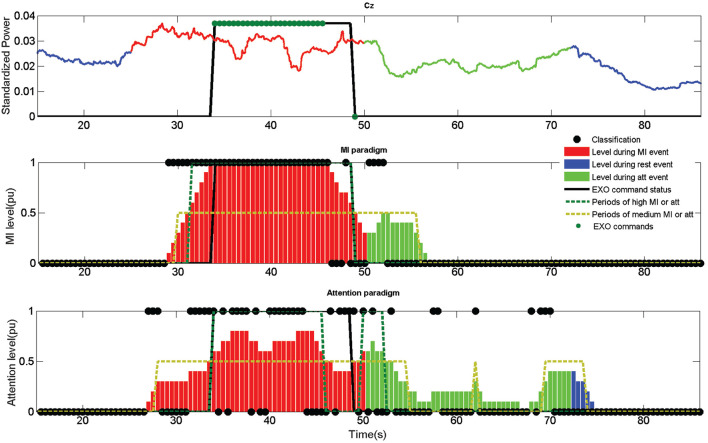
Figure 7.
Output information of the fifth opened-loop training trial of subject S1. Up image shows the output of the MI paradigm features for electrode Cz. Center image shows the MI classifier output. Down image shows the attention classifier output. Mental tasks are color coded (Blue for rest, red for walk and green for count). MI and attention levels are shown for each paradigm in bars ranged from 0 to 1. A high level is considered when the bars are above 0.5 (green dotted) and a medium level when it is above 0.25 (golden dotted). Classifier outputs are shown as •, and exoskeleton commands as •. Rex command status is represented as a thicked black line, which would represent the status of the exoskeleton in the case the commands could be issued instantaneously without any hardware lag. The exoskeleton was commanded for this example using the MI+att paradigm based on the periods of high and medium MI and attention.

