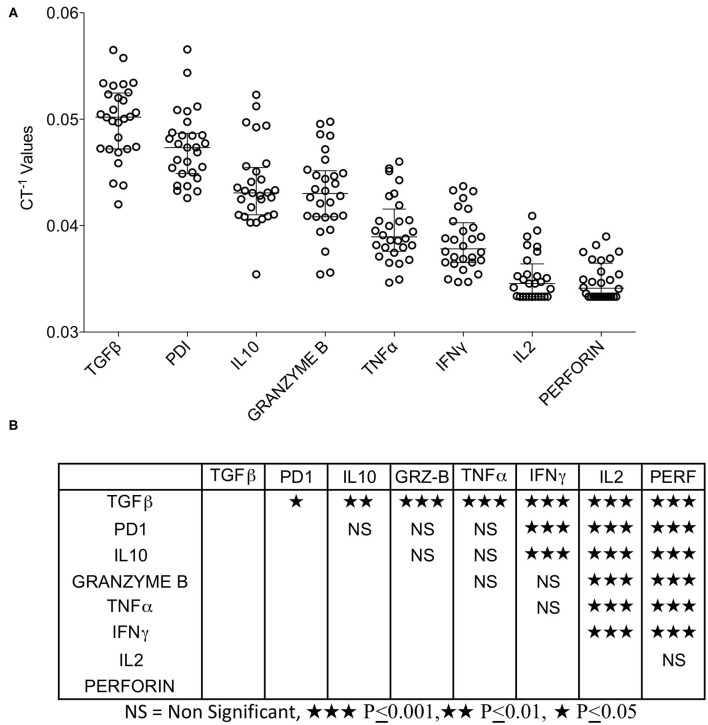
Figure 3.
Expression pattern of immune responsive effector molecules in HCC. RNA transcripts of immune responsive effector molecules TGFβ, PD-1, IL-10, IFNγ, TNFα, IL-2, Granzyme B and Perforin were analyzed in FluidigmTM nanoscale quantitative RT-PCR. (A) Inverse CT values (CT−1) of immune responsive effector molecules derived from each patient were plotted with the median and range. Median values were organized in hierarchical order of high to low expression. (B) One-way ANOVA and Tukey's multiple comparison test was performed to obtain P-values. Table shows the statistical significance of the median of CT−1 values of each effector molecule in comparison to others. CT values were normalized based on GAPDH & beta actin controls.

