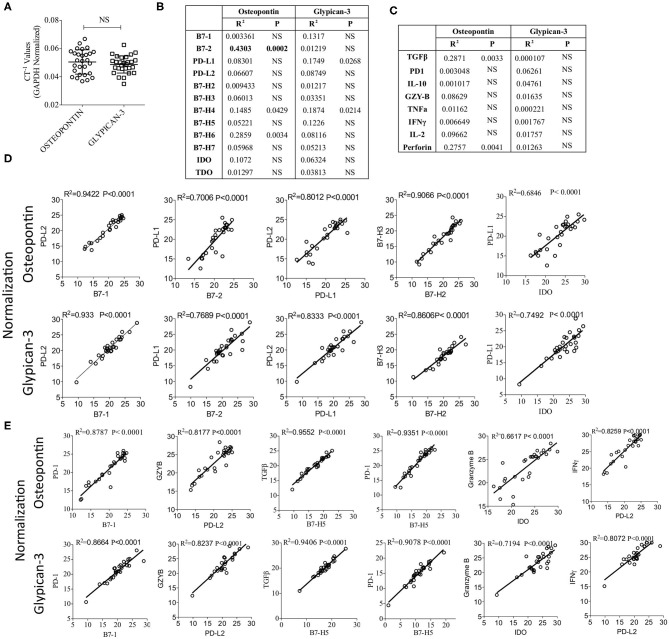
Figure 5.
Validation of the identified correlations using HCC biomarkers Osteopontin and Glypican-3. (A) Inverse CT values (CT−1) of Osteopontin and Glypican-3 derived from each patient, after GAPDH & beta actin normalization, were plotted with median and range. CT values of Osteopontin and Glypican-3 were subjected to linear regression analysis with (B) B7 Family ligands, Tryptophan Degrading enzymes and (C) immune response genes. Correlation R2 values and statistical significance are shown in a table format. (D,E) GAPDH & beta actin normalized CT values were further normalized based on the expression of Osteopontin or Glypican-3. Correlations that are identified in Figures 2, 4 were further confirmed using Osteopontin and Glypican-3 normalization. (D) Correlations between B7 family ligands and IDO. (E) Correlations between B7 family ligands, IDO and immune response genes. Linear regression analysis was performed in GraphPad Prism to get R2 and P-values. R2, Goodness of Fit; P, Significance of the slope deviation from Zero; NS, Non-significant.

