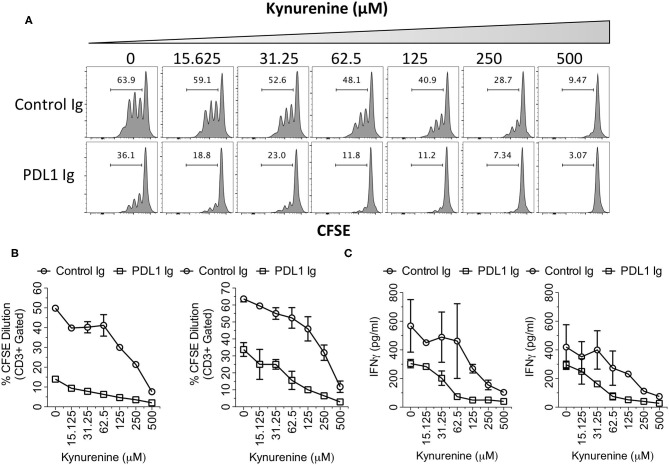
Figure 6.
Synergistic inhibitory effects of PD-L1 and Kynurenine on T cell responses. CFSE labeled PBMCs were stimulated on the plates coated with anti-CD3 and anti-CD28 (1 μg/ml) alone or in combination with PD-L1 Ig or Control Ig (10 μg/ml). Subsequently, Kynurenine was added to the culture at a final concentration as indicated. 4 days later, T cell proliferation analysis was performed using flow cytometry. (A) Representative CFSE dilution plot is shown. CFSE plots were derived from Forward Scatter, Side Scatter, CD3+ parental gates. (B) % CD3+ CFSE dilution is plotted with two independent donors. (C) Supernatants of the cultures were analyzed for human IFNγ using ELISA. Concentrations of the IFNγ are shown from two independent experiments using independent donor PBMCs.

