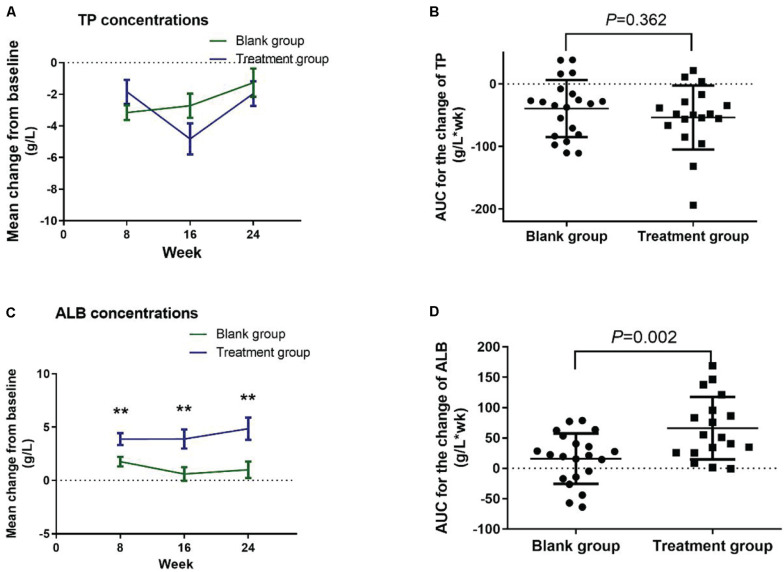
FIGURE 4.
Change in the serum TP and albumin concentrations from baseline in the intervention study. (A) Change in serum TP concentrations; (B) AUC for the change of TP concentrations; (C) change in serum albumin concentrations; (D) AUC for the change of albumin concentrations. Data were analyzed using GLM repeated measures, with an LSD post hoc test. **P < 0.01 versus blank group. Data presented in the figures are means and SEM. TP, total protein; ALB, albumin; AUC, area under curve.

