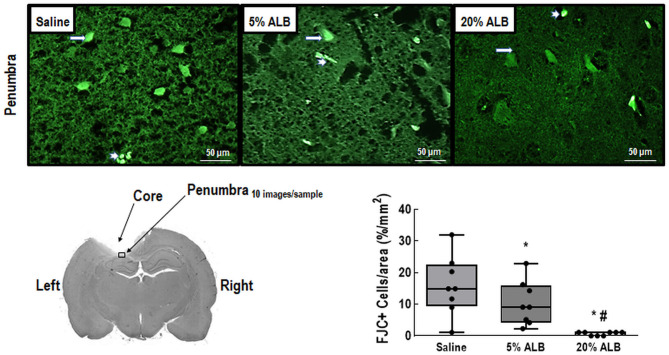
Figure 2.
Comparison of Fluoro-Jade C (FJC) staining between Saline (0.9% NaCl), 5% ALB (albumin), and 20% ALB groups. Long arrows point to FJC-positive cells, and short arrows, to vessels. Note representative diagram of a brain slice after ischemic brain injury, indicating the core and penumbra regions. Within the penumbra, a sample area from which FJC images were taken is highlighted. Comparisons among groups were performed by the Kruskal–Wallis test followed by Dunn's test. * vs. Saline; # vs. 5% ALB. Significance accepted at p < 0.05.

