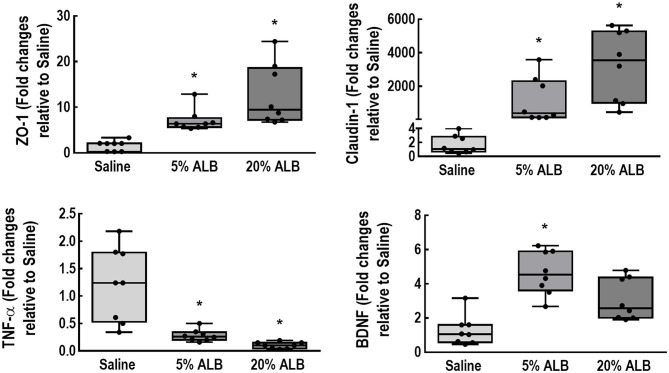
Figure 3.
Expression of biologic markers associated with brain damage. Real-time polymerase chain reaction analysis of biologic markers associated with blood-brain barrier integrity (zonula occludens [ZO]-1 and claudin-1), brain inflammation (tumor necrosis factor [TNF]-α), and neurotrophic activity (brain-derived neurotrophic factor [BDNF]). Boxes show the interquartile range (25–75th percentile), while whiskers encompass the range (minimum-maximum) and horizontal lines represent the median in 8 animals/group. Scatter plots are also presented. Relative gene expression was calculated as a ratio of average expression of each gene to the reference gene (36B4) and expressed as fold change relative to Saline group. Comparisons among all groups were done using the Kruskal–Wallis test followed by Dunn's post hoc test. * vs. Saline. For all comparisons, significance accepted at p < 0.05.

