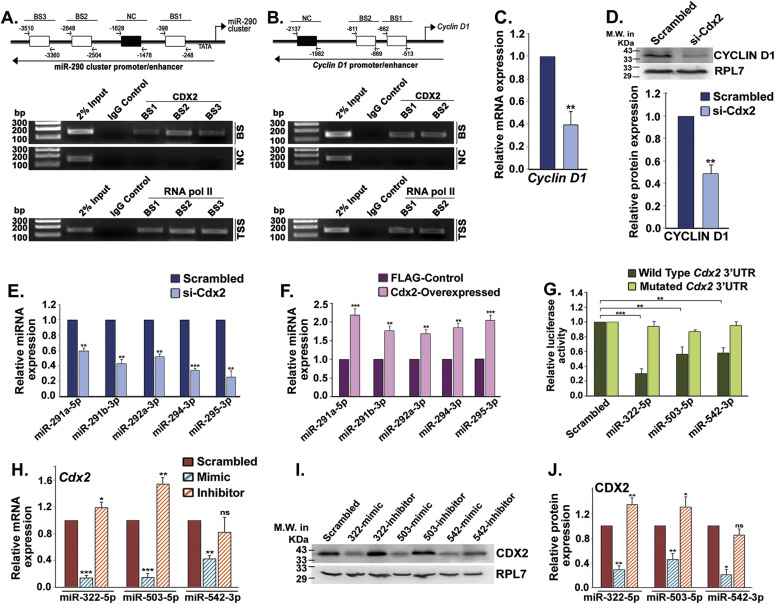
Figure 5. CDX2 transactivates miR-290 cluster, cyclin D1 promoter in trophoblast stem (TS) cells, and miR-322 cluster members directly inhibit CDX2.
(A, B) ChIP analyses revealed direct binding of CDX2 in miR-290 cluster (A) and cyclin D1 (B) promoter regions. BS indicates binding site. (C, D) Real-time PCR analysis of Cyclin D1 (C) and Western blot analysis of CYCLIN D1 (D) in CDX2 knocked down TS cells. Shown in the following is the NIH imageJ analysis of Western blot. (E) TaqMan assays of miR-290 cluster members in Cdx2 knocked down TS cells. (F) TaqMan assays of miR-290 cluster members in CDX2 overexpressed TS cells. (G) Relative luciferase assay showing the repressive effect of miR-322/503/542 mimic on wild-type Cdx2-3′-UTR. (H, I, J) Quantitative real-time PCR analysis of Cdx2 (H) and Western blot analysis of CDX2. (I) in TS cells transfected with mimic or inhibitor of miR-322 cluster members. Quantification of protein expression using NIH imageJ analysis of the Western blot. (J) Data are presented in means and standard error of the mean of three replicates (n = 3). *P < 0.05; **P < 0.005; ***P < 0.0005; ns, nonsignificant compared with control.
Source data are available for this figure.

