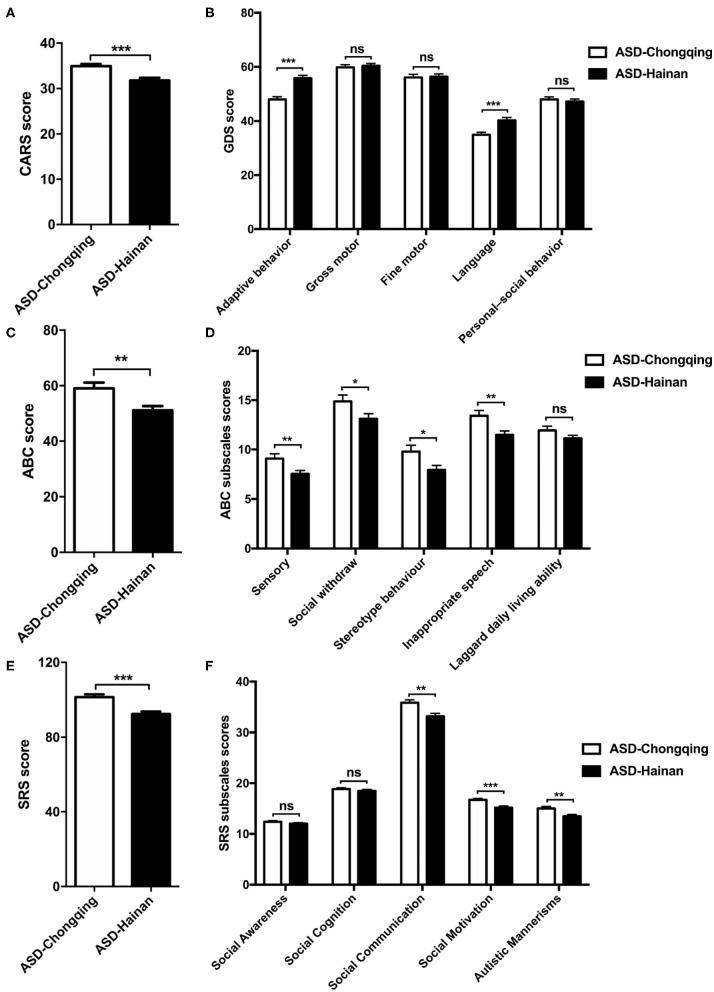
Figure 1.
Comparison of CARS, GDS, ABC, and SRS scores in children with autism in Chongqing and Hainan. The CARS (A), GDS (B), ABC (C), SRS (E) scores, subscales scores of ABC (D), and SRS (F) of ASD children in Chongqing (n = 445) and Hainan (n = 293) were compared. The values are the means ± SEMs. The t-test test was used for the comparison; *P < 0.05, **P < 0.01, ***P < 0.001.

