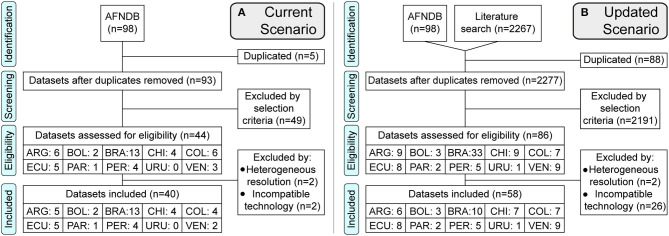
Figure 1.
PRISMA flowchart of the literature review. Flow diagram of the datasets processed. (A) Current Scenario, using only the datasets available in the Allele Frequency Net Database. (B) Updated Scenario, adding databases from scientific literature until April 10, 2020. Countries are represented by the first three letters of their names. PRISMA checklist included in the Supplementary Material (77).

