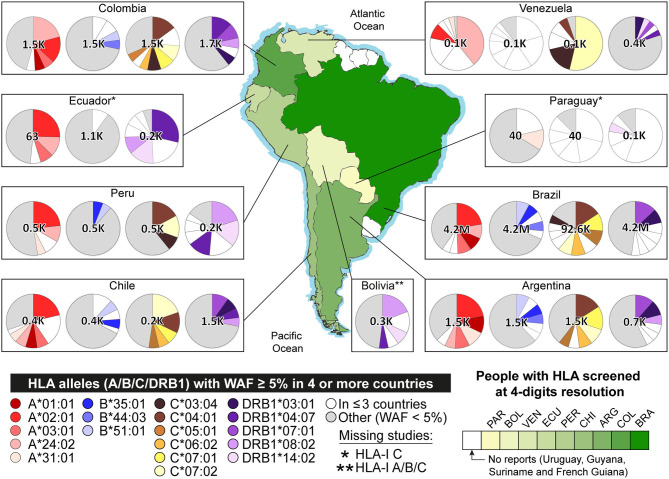
Figure 2.
Allele frequencies of HLA-I A, B, C, and HLA-II DRB1 in South America. The pie charts represent the distribution of allele frequencies in genes HLA-I A, B, C, and HLA-II DRB1. Alleles with Weighted Allele Frequency (WAF) ≥ 5% in four or more countries are represented in scales of red (A), blue (B), brown (C), and purple (DRB1), respectively. Alleles with WAF ≥ 5% in three or fewer countries are shown in white. Alleles with WAF < 5%, are shown in gray. The green gradient represents the extent of people with HLA alleles genotyped. Detailed data is available in Tables S5, S6.

