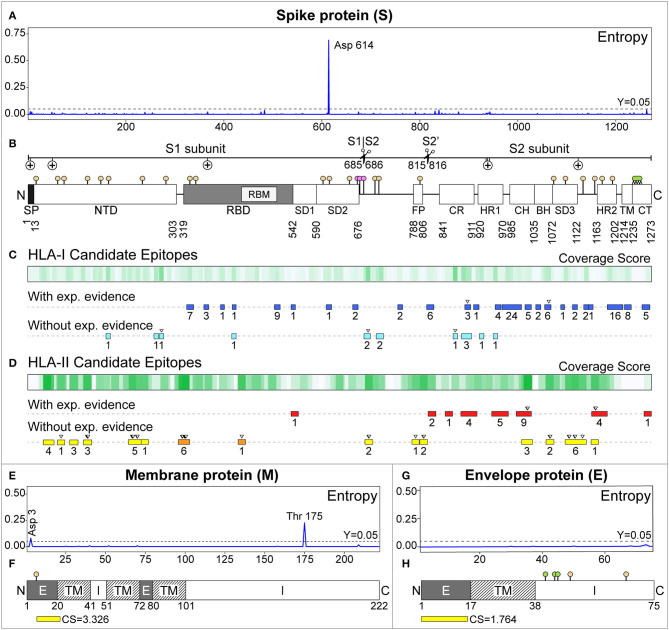
Figure 3.
Candidate epitopes in the sequence of the Membrane (M) and Spike (S) proteins of SARS-CoV-2. (A,E,G) Show the entropy per amino acid for the S, M, and E proteins, respectively, calculated by aligning 2123 SARS-CoV-2 genomes. In (B,F,H), post-translational modifications are represented as sticks with colored circles: beige (N-linked glycosylations), pink (O-GalNAc glycosylations), and lemon (palmitoylations). (B) Regions of the S protein, indicating the subunits 1 (S1), 2 (S2), and cleavage points (scissors). Positive selection pressure is represented with (+). SP, Signal peptide; NTD, N-terminal domain; RBD, Receptor Binding Domain; RBM, Receptor Binding Motif; SD1, Sub-Domain 1; SD2, Sub-Domain 2; FP, Fusion Peptide; CR, Connecting Region; HR1, Heptad Repeat 1; CH, Central Helix; BH, B-Hairpin; SD3, Sub-Domain 3; HR2, Heptad Repeat 2; TM, Transmembrane domain; CT, Cytoplasmic tail. (C) HLA-I epitopes predicted for South American alleles with WAF ≥5%. The gradient of green represents the coverage scores. The rectangles below represent the predicted epitopes with experimental evidence in the IEDB (blue), and those without experimental evidence with CS ≥2 (light blue). Overlapping predicted epitopes are represented by a single rectangle with the number of epitopes contained (underneath). The inverted triangle on top highlights our best candidates. (D) Analogously, for HLA-II. Predicted epitopes with experimental evidence are shown in red. Without experimental evidence and CS ≥6, in yellow. Those in the RBD are highlighted in orange. (F,H) Represent the topology of the M and E proteins, respectively. Exposed (E), transmembrane (TM), and intra-virion (I) regions were extracted from annotated proteins (UniProtKB IDs: P0DTC4 and P0DTC5). The best HLA-II epitopes predicted in their exposed regions (and their CS) are shown in yellow.

