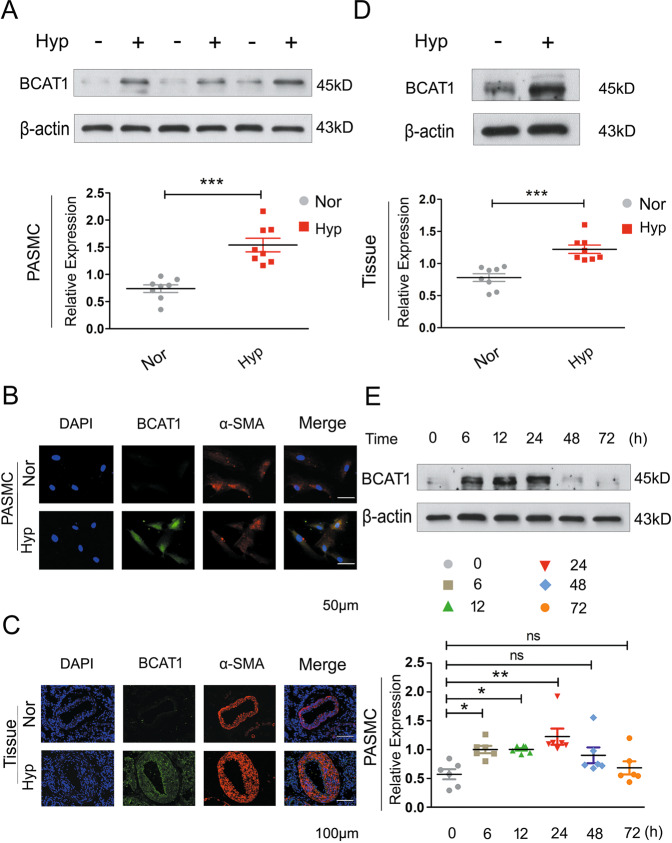
Fig. 1. Hypoxia resultes in the increased expression of BCAT1.
a Western blot analysis of BCAT1 expression in hypoxic PASMCs (n = 8). b Subcellular distribution of BCAT1 in PASMCs determined by immunofluorescence analysis. Scale bars: 50 μm (n = 3). c The cellular expression of BCAT1 in the smooth muscle layer of lung tissues from hypoxic model rats determined by immunofluorescence staining analysis. Scale bar = 100 μm (n = 3). d BCAT1 protein levels in pulmonary arterial tissues of hypoxia model rats (n = 8). e Time course of BCAT1 expression of PASMCs at 0, 6, 12, 24, 48, and 72 h after hypoxia treatment (n = 6). Nor normoxia, Hyp hypoxia, Mct monocrotaline. Statistical analysis was performed with one-way ANOVA or the Student’s t test. All values are presented as the mean ± SEM. *p < 0.05; **p < 0.01; ***p < 0.001; ns not significant.

