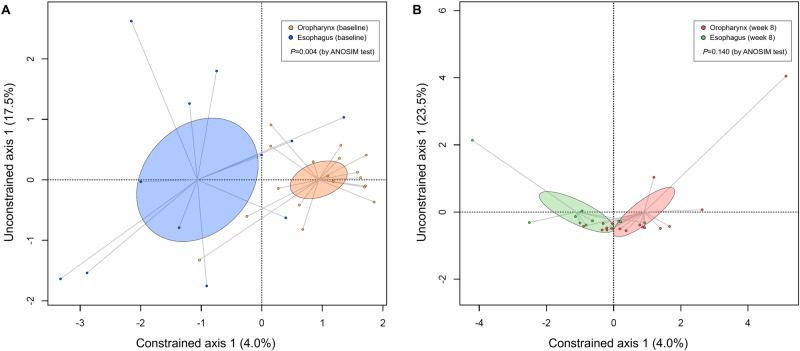
Figure 4.
Principal component analysis of the microbiome according to the organ (oropharynx vs. esophagus) at (A) baseline and (B) week eight. At baseline, the oropharynx had different microbial composition compared to the esophagus (P = 0.004 by the ANOSIM test). On the contrary, at week eight, the difference in microbial compositions between the organs (oropharynx vs. esophagus) were not identified (P = 0.140 by the ANOSIM test). ANOSIM, analysis of similarities.

