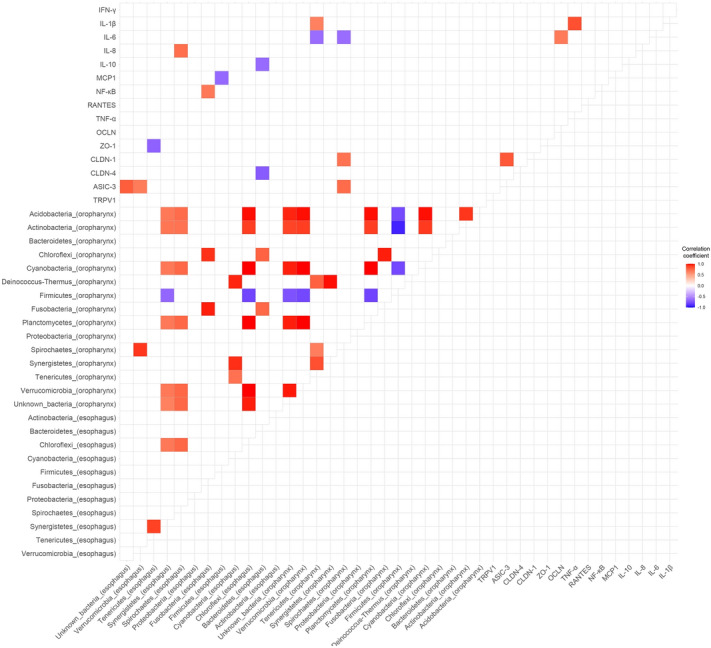
Figure 5.

Correlations between the expression of biologic marker and the relative abundance of bacterial taxa (n = 10). The heatmap indicates the correlation coefficients between the expression of biologic markers and the relative abundance of bacterial taxa at the phylum level. Only statistically significant correlations are presented in this heatmap. The correlation was more common between bacterial taxa and other bacterial taxa. NF-κB, IL-1β, and IL-8 were correlated with esophageal Fusobacteria (γ = 0.68, P = 0.032), oropharyngeal Tenericutes (γ = 0.64, P = 0.048), and esophageal Spirochaetes (γ = 0.72, P = 0.018), respectively. γ, correlation coefficient.
