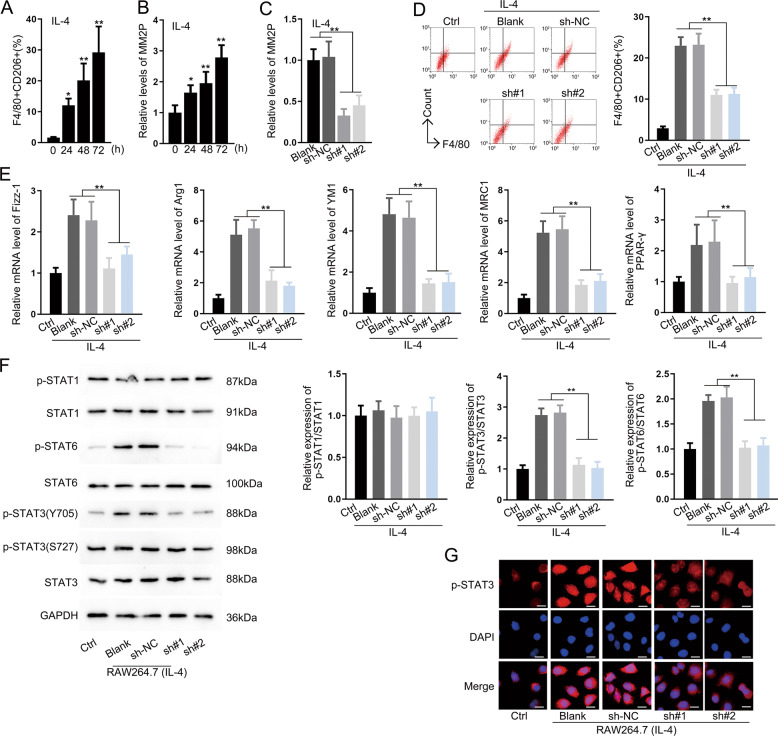
Fig. 1. MM2P facilitated M2 polarization.
a Flow cytometry analysis for the ratio of F4/80+CD206+ in RAW264.7 cells after treatment with IL-4. b Level of MM2P following the induction of M2 polarization at the indicated time. c The effect of sh-MM2P#1/2 transfection on the expression of MM2P in IL-4-induced M2 macrophages was measured by RT-qPCR. d Pictures of flow cytometry of F4/80+CD206+ cells and quantification of F4/80+CD206+ cell ratio under MM2P depletion in IL-4-induced cells. e RT-qPCR data for the levels of M2-related genes (Fizz-1, Arg1, YM1, MRC1, PPAR-γ) under the treatment of IL-4 with MM2P depletion in RAW264.7 cells. f Western blot for the total and phosphorylated STAT1, STAT6, and STAT3 in RAW264.7 cells treated with IL-4. g IF staining for the fluorescence intensity of p-STAT3 under IL-14 stimulation, as well as depletion of MM2P. Scale bar = 20 μm. **P < 0.01. Error bars are said to express as mean ± SD of three independent experiments in triplicates.

