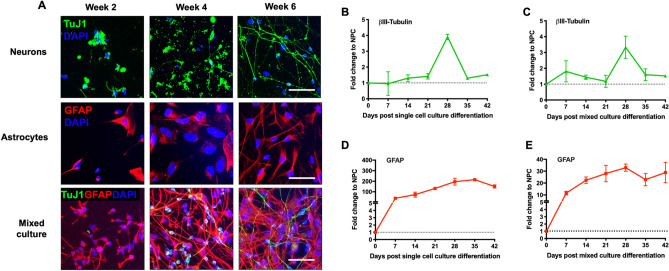
Figure 1.
Differentiation and characterization of mixed 2D primary brain cultures. (A) NPCs were differentiated into either single culture or mixed cultures according to the protocol described and characterized for expression of cell specific markers by immunofluorescence. Representative images comparing single cell and mixed culture differentiation are depicted. Neurons were stained with βIII Tubulin Tuj1 (green) and astrocytes were stained with GFAP (red) and nucleus with DAPI (blue) at week 2, 4 and 6 post differentiation. Scale bar, 50 μm. (B,C) Time-course RNA analysis of the neuronal marker βIII Tubulin expression during differentiation in monocultures (B) compared to mixed culture (C) by qRT-PCR. (D,E) Time-course analysis of GFAP RNA, astrocyte marker expression during differentiation in monocultures (D) compared to mixed culture (E) by qRT-PCR. Fold change was calculated by normalizing expression level in undifferentiated NPCs in (N = 3) independent experiments.

