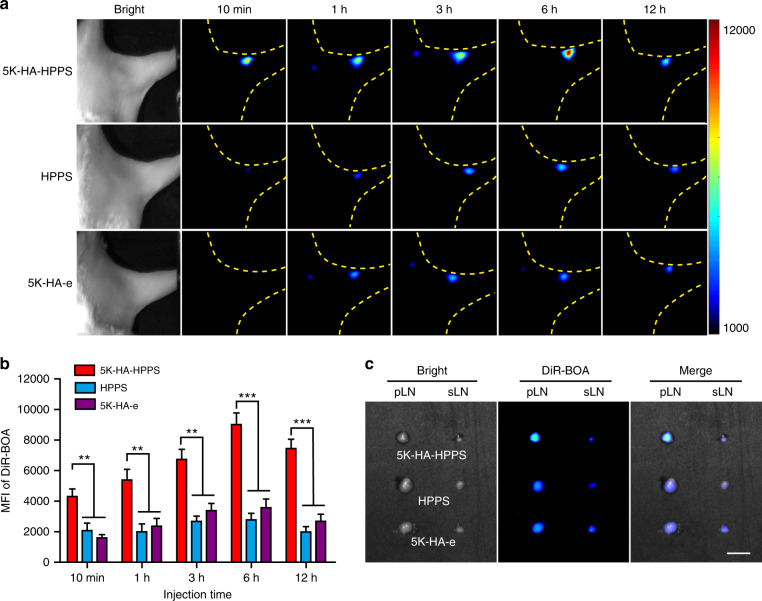
Fig. 3. In vivo comparison of the migratory capabilities of 5K-HA-HPPS, HPPS and 5K-HA-e to pLNs.
a Representative fluorescence images to observe the migratory capabilities of 5K-HA-HPPS, HPPS and 5K-HA-e to pLNs at 10min, 1, 3, 6 and 12 h after intradermal footpad injection. b Quantitative analysis of the mean fluorescence intensity of DiR-BOA in pLNs. c Fluorescence imaging was performed 12 h after injection on resected pLNs and sciatic LNs (sLNs). Scale bar: 2 mm. Data are presented as the mean ± SD (two-tailed t-test; n = 5 animals per group)

