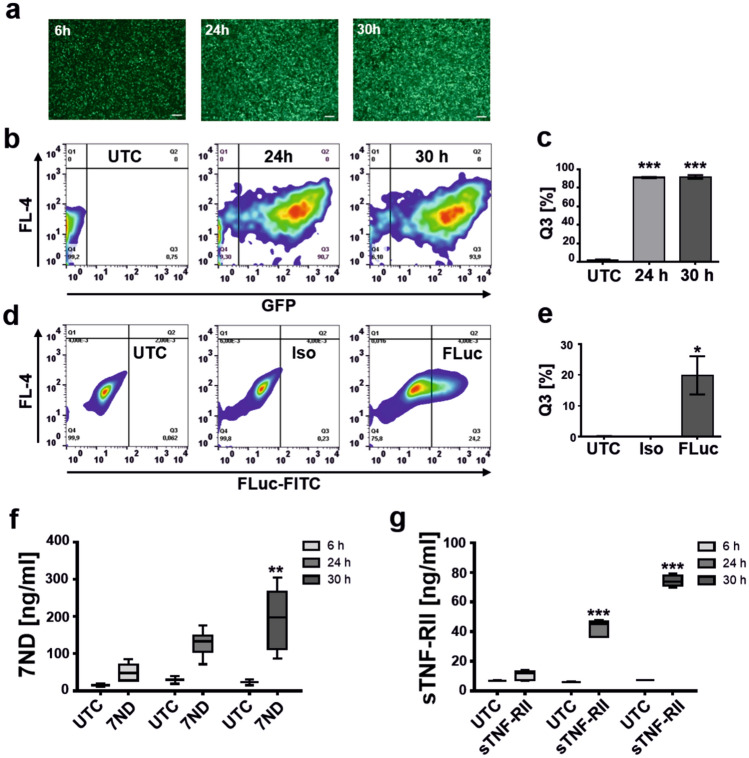
Figure 1.
Viromers efficiently transfect murine macrophages. (a) Time-dependent appearance of GFP fluorescence in RAW264.7 macrophages observed by fluorescence microscopy after 6 h, 24 h and 30 h post transfection. Scale bar: 100 µm. (b,c) FACS analysis 24 h and 30 h after transfection of RAW264.7 macrophages using GFP-mRNA (100 ng/well) in comparison to untreated cells (UTC) and quantification (c) of GFP-positive cells in Q3 of the FACS plot. Mean ± SD, one-way ANOVA, Dunnett test, ***p < 0.001, n = 3. (d,e) Intracellular FLuc reporter gene expression (100 ng/well) analysed by FACS 24 h after transfection in comparison to UTC and isotype control (Iso) and quantification of FLuc-positive cells in Q3 of the FACS plot (e). Mean ± SD, one-way ANOVA, Dunnett test, *p < 0.05, n = 2. (f) Expression of 7ND (100 ng/well) in RAW264.7 macrophages analysed by ELISA 6 h, 24 h and 30 h post transfection. Graph shows box and whiskers (min to max), line at mean, two-way ANOVA, Sidak multiple comparison test, **p < 0.01, n = 2 (UTC), n = 6 (7ND). (g) Expression of sTNF-RII (100 ng/well) in RAW264.7 macrophages analysed by ELISA 6 h, 24 h and 30 h post transfection. Graph shows box and whiskers (min to max), line at mean, two-way ANOVA, Sidak multiple comparison test, ***p < 0.001, n = 2 (UTC), n = 6 (7ND).

