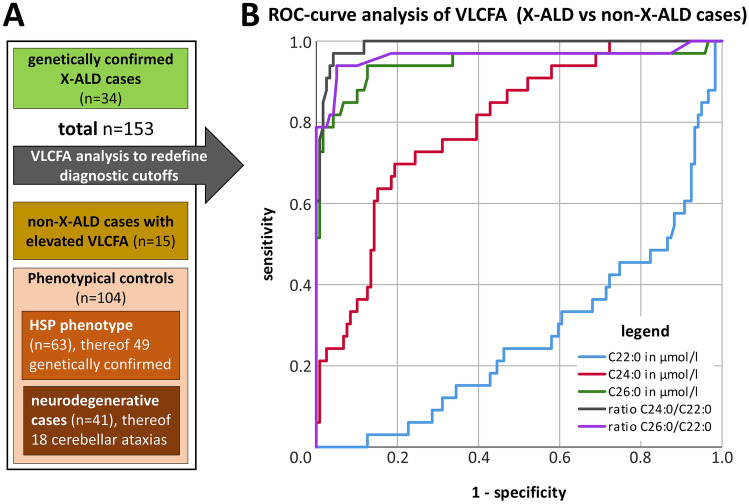
Figure 2.
VLCFA evaluation in phenotypically similar patients. (A) Using the same dataset, the VLCFA values of phenotypically similar patients (black box—n = 153) were evaluated to redefine diagnostic cutoffs. The positive VLCFA cases (n = 45; 30 X-ALD and 15 Non-X-ALD) identified via the screening since 01/2008 (compare Fig. 1) were combined with four X-ALD patients with VLCFA values below the previously used cutoffs totaling 34 X-ALD cases. Phenotypical controls (n = 104) matching the Non-X-ALD cases phenotypically with elevated VLCFA (compare Table 3) were chosen from the same dataset. (B) ROC- analysis of X-ALD versus Non-X-ALD cases was performed using all five VLCFA measures (color coding see legend within the Figure) for the 153 phenotypically similar cases (as specified in the “Methods” section—see redefining diagnostic cutoffs). Sensitivity and specificity were highest for the C24:0/C22:0 ratio followed by the C26:0/C22:0 ratio and the C26:0 absolute value.

