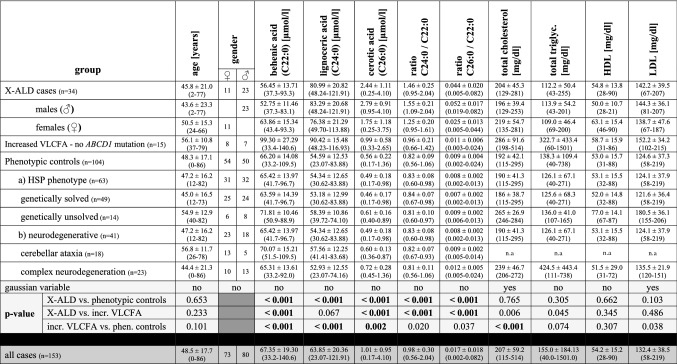
Table 3.
VLCFA and plasma cholesterol levels in X-ALD patients and Non-X-ALD cases (increased VLCFA cases and phenotypic controls).
Data are presented as mean ± standard deviation (range (maximum-minimum value)). The Shapiro–Wilk Test tested Gaussian distribution due to 3 < n < 3,000. All Gaussian variables were tested using the two-sided t-test and the Mann–Whitney-U-test tested non-Gaussian variables. Bonferroni correction for all tested parameters considered all p-values below an alpha of 0.5% (10 items) to be statistically significant, showing in bold the significant findings. All mutations of the X-ALD patients can be found in supplementary Table 1.
incr.: increased; n.a.: not analyzed; phen.: phenotypic

