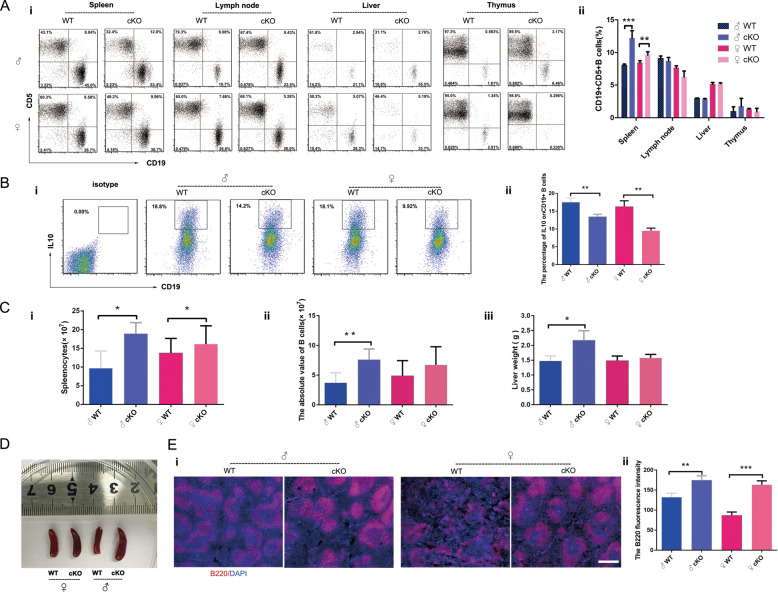
Fig. 3. PKC-δ deficiency in B cells is accompanied by changes in B-cell number, function, and distribution.
a Flow-cytometric analysis of the percentage of CD19+CD5+ B cells in spleen, lymph nodes, liver and thymus from WT and PKC-δ cKO mice (i), with bar charts showing the quantification (ii); b Flow-cytometric analysis of the percentage of IL-10+CD19+ B cells in splenocytes from WT and PKC-δ cKO mice (i), with bar charts showing the quantification (ii); c The number of splenocytes was counted after single-cell suspensions were prepared from pooled spleens of WT and PKC-δ cKO mice (i). The absolute number of splenic CD19+ B cells was determined after B-cell sorting (ii). The liver weight was measured after complete separation of liver from WT and PKC-δ cKO mice (iii); d Representative image of general appearance of spleens from WT and PKC-δ cKO mice; e Representative images of immunofluorescent staining from lymphoid follicles in the spleen of WT and PKC-δ cKO mice (i). Cryosections were stained with anti-B220 (Red) and DNA was stained with DAPI (blue), bar represents 200 μm. B220 fluorescence intensity was measured using ImageJ software (ii). Data were presented as mean ± SD (n = 4). *p < 0.05, **p < 0.01, ***p < 0.001 compared with WT control.

