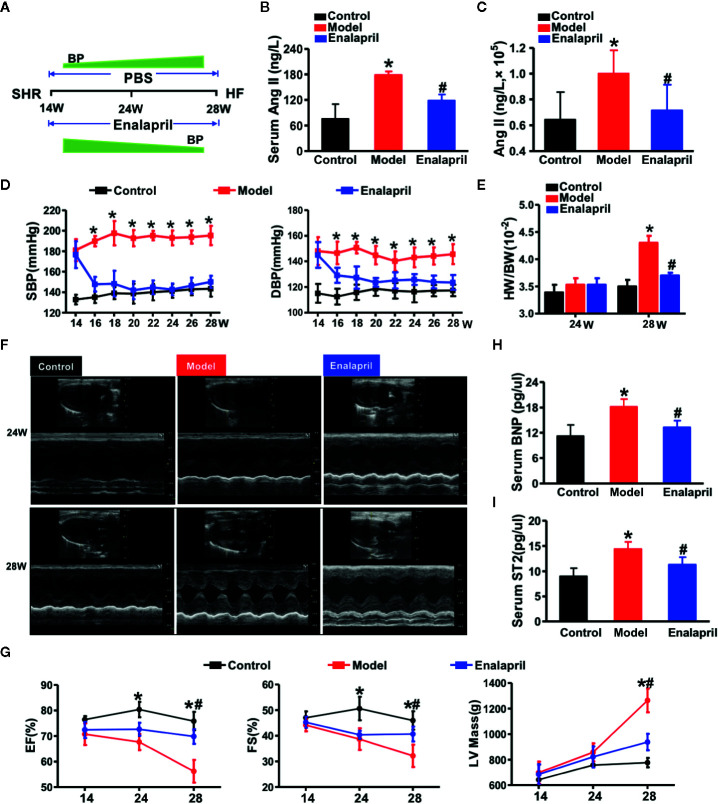
Figure 3.
High Ang II-induced hypertensive heart failure. (A) Illustration of the experimental strategy in this work. (B, C) Ang II concentrations in serum or myocardial tissue. *P < 0.05 vs. control, # P < 0.05 vs. model. (D) Blood pressure reduction in SHRs treated by enalapril for 14 weeks. *P < 0.05 vs. model. (E) Ratio of heart weight and body weight in SHR or treated by enalapril at 28 weeks. *P < 0.05 vs. control, # P < 0.05 vs. model. (F) Echocardiographic phenotype in SHRs or treated by enalapril at 24 and 28 weeks respectively. (G) Quantification of cardiac function at different time-points (EF, FS, LV mass). * P < 0.05 vs. control, # P < 0.05 vs. model. (H, I) Serum biomarker concentrations of myocardial injuries (BNP, and sST2) in SHRs at 28 weeks. * P < 0.05 vs. control, # P < 0.05 vs. model. Ang II, angiotensin II; SHRs, spontaneously hypertensive rats; EF, ejection fraction; FS, fractional shortening; LV mass, left ventricular mass; BNP, brain natriuretic peptide; sST2, soluble suppression of tumorigenicity-2.

