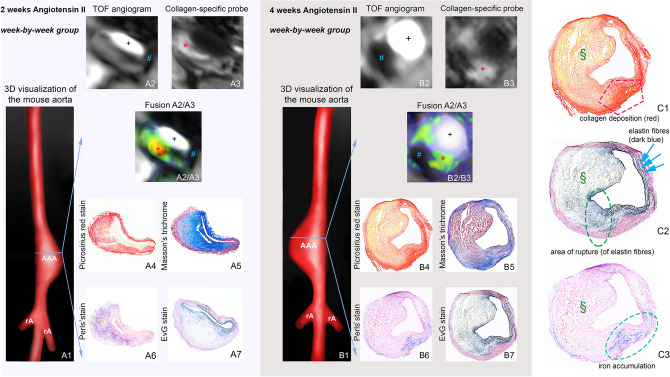
Figure 4.
In vivo molecula r MRI with collage-targeted and inflammation-specific probes (week-by-week study). 3D visualization of AAAs after 2 weeks (A1) and 4 weeks (B1) of Angiotensin II (AngII) infusion. (A2,B2) Iron oxide MRI indicating signal voids of different sizes for 2-week (A2) and 4-week (B2) AAAs. (A3,B3) IR T1-weighted sequences showing areas of intermediate signal enhancement after 2 weeks (A3) and four weeks (B3) of AngII infusion. A2/A3) and B2/B3) are fusions of (A2/A3) and (B2/B3), showing both the positive signal of the collagen-targeted probe (green to yellow/orange, with brighter colors corresponding to higher enhancement) and the signal voids of the iron oxide probe. (A4–7,B4–7): Ex vivo histological measurements using Picrosirius red and Masson’s trichrome for visualization of collagen fibers and Perls’ staining for detection of inflammation-associated iron confirmed the in vivo findings. (C1–C3) are magnifications of (B4,B7 and B6): (C1) shows compensatory collagen deposition in the aneurysmal wall after rupture. (C2) shows the rupture site (green circle) with the ruptured elastin fibers. (C3) shows the iron accumulation at the rupture site. *Signal from the collagen-binding probe in the aneurysmal wall, #Signal void from the iron oxide particles, §Thrombus area. AAA suprarenal abdominal aortic aneurysm, rA renal artery, +Vascular lumen in arterial TOF.

