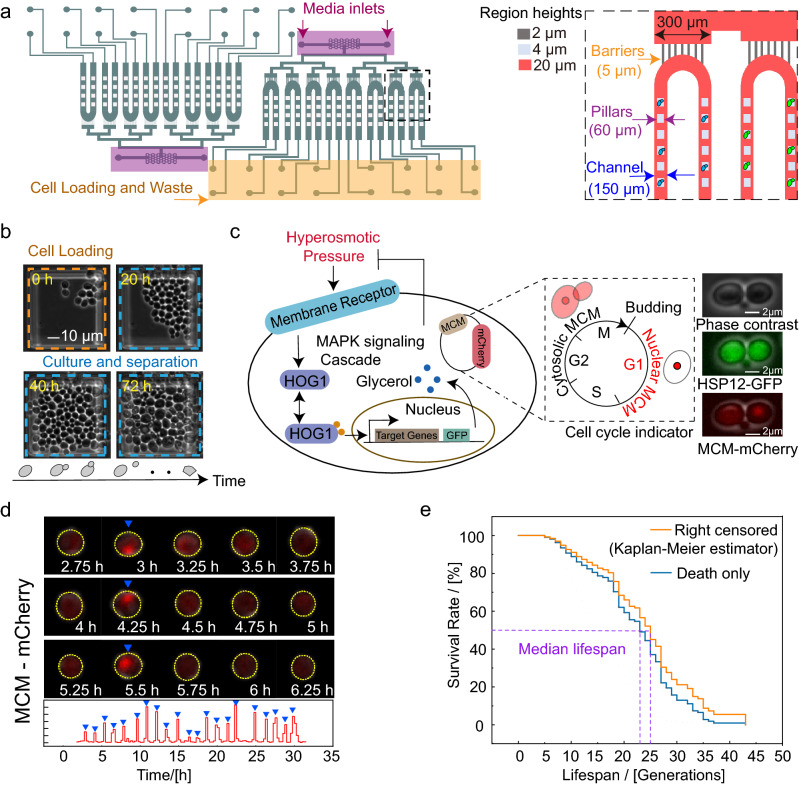
Figure 1.
Principle of the microfluidic device and yeast strain construction. (a) (left) Schematic diagram of the overall image of the microfluidic chip. (right) Details of the barriers and cell traps. The chip was fabricated by three-layer structures with different heights for the barriers (2 µm), trapping pillars (4 µm) and the main channels (20 µm). Green and blue ellipses indicate yeast strains with different labels in different channels. (b) Images of yeast culture in a chip. Yeast cells were loaded into the chip, and mother cells were trapped and cultured under the pillar. (c) (left) Schematic representation of the HOG1-MAPK pathway and illustrative schematic of the dual reporter construct. The target genes were tagged with GFP, and the MCM gene associated with the cell cycle was labeled with m-Cherry. (right) Images of phase contrast, GFP and m-Cherry channels. The scale bar represents 2 µm. (d) Microscope images of the m-Cherry channel taken at the indicated time points during a part of the cell’s lifespan (up) and the nuclear m-cherry intensity of the cell as a function of time (down). The yellow contours highlight the cell of interest, and the blue triangles indicate the times at which budding occurred. (e) Kaplan–Meier estimator with right censored cells [orange curve] and cells born earlier than 15 h and died eventually during the observation time (blue curve). The intersections of the purple dotted line and the survival curves represents the median lifespan.

