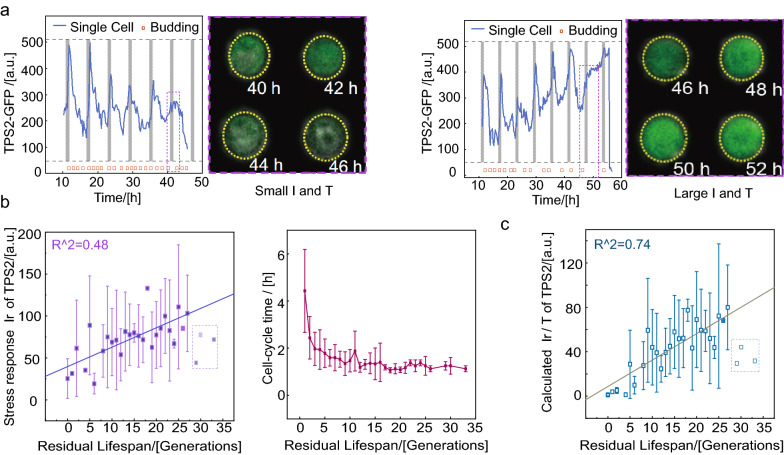
Figure 3.
Ir/T instead of Ir shows the better linear correlation with residual lifespan. (a) Two examples of GFP-labeled TPS2 before death in response to KCl stimuli. Vertical dashed lines indicate osmotic shock. (b) Relationship between averaged Ir and T of the TPS2-GFP strain and residual lifespan. The solid blue line represents the linear fitting line. In curve fitting, light data points in the dashed box are excluded. (c) Relationship between averaged Ir/T of TPS2 and residual lifespan. The solid turquoise line represents the linear fitting line. In curve fitting, light data points in the dashed box are excluded.

