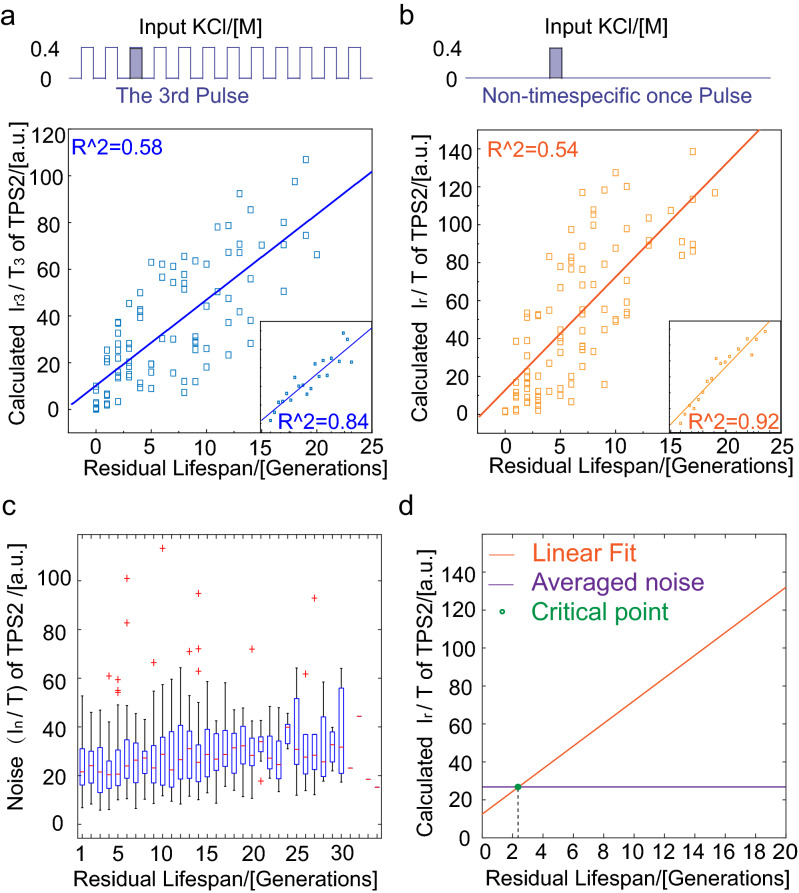
Figure 4.
A weakening response in cellular stress response and TPS2 was identified as a lifespan marker. (a) Periods stimuli, every 6 h with 1-h stimuli of 0.4 M KCl for 72 h and (b) 1 h stimuli of 0.4 M KCl from 23 to 24 h. Response capacity Ir/T of TPS2 and residual lifespan showed a significant positive correlation (two sets of experiments contained 97 and 99 cells, respectively). The lilac column represents the moment of adding osmotic stimulation. (c) Characterization of internal noise during the lifespan of yeast cells. (d) The relationship between TPS2 production (solid line, linear fit) and the internal noise (more than 60 cells).

