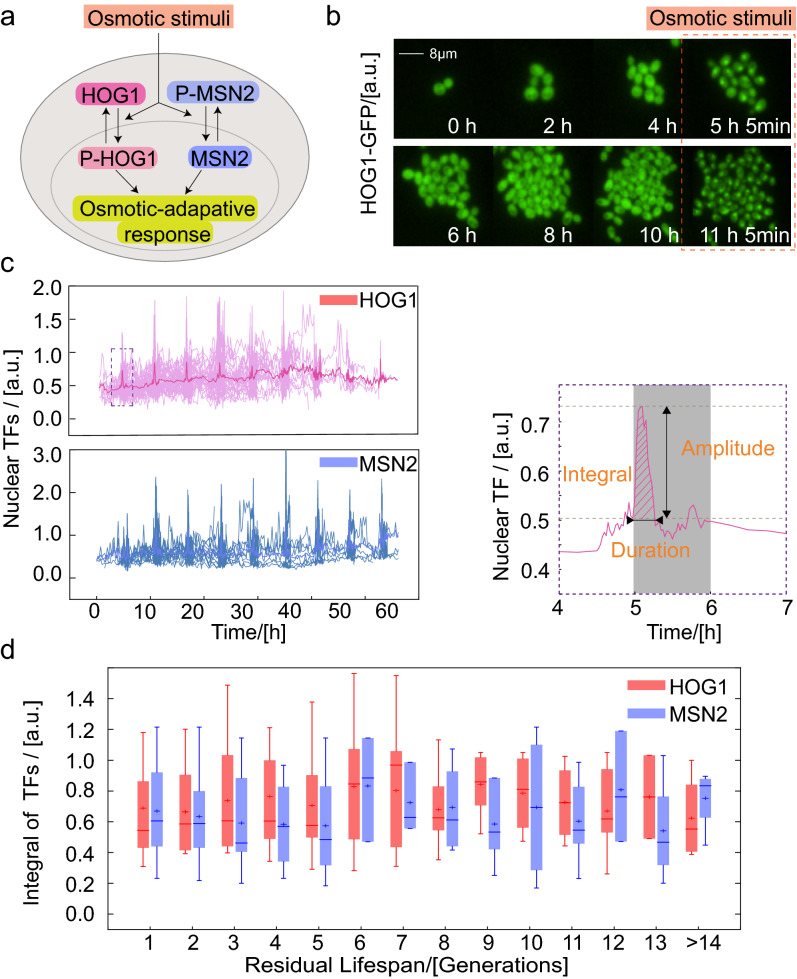
Figure 5.
Transcription factors remain equivalent during the aging process. (a) Transcription factors (HOG1 and MSN2) translocate into the nucleus in response to osmotic stimuli. (b) HOG1-GFP images at the indicated times. The orange dotted box represents the stimulation time. (c) In response to a step stimulus of 0.4 M KCl, dynamic curves of single-cell HOG1 and MSN2 nuclear enrichment. Averaged trace of single-cells is shown in dark (left). The schematic defines the amplitude, duration and integral (oblique line) of the nuclear translocation of transcription factors in a single-cell time trace (right). (d) Integral of TFs corresponding to the datasets described in (c). Boxes extend from the 25th to 75th percentiles [interquartile range (IQR)]; horizontal lines represent the median, and whiskers indicate the lowest and highest datum within 1.5 × IQR from the lower and upper quartiles, respectively.

