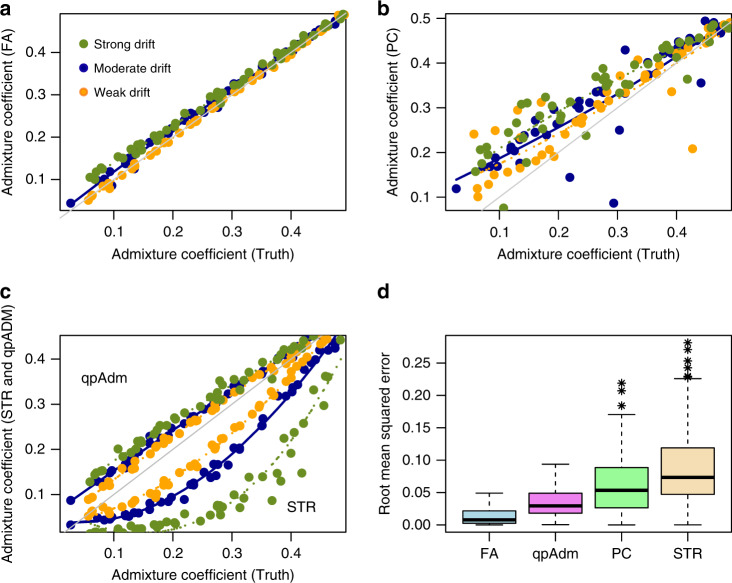
Fig. 2. Comparisons of ancestry estimates.
Inference of ancestry proportions in two-way admixture models with high level of divergence between the ancestral populations (FST = 25%). a Ancestry estimates obtained from FA for three levels of drift intensity represented in green, blue and orange colors, b Ancestry estimates obtained from PC projections on admixed samples, c Ancestry estimates from qpAdm (above diagonal) and STRUCTURE (STR, below diagonal), d Root mean squared errors for admixture estimates from the four methods. FA: Factor Analysis, PC: Projections on PCs of admixed samples, STR: STRUCTURE estimates computed with non-negative matrix factorization. Boxplots computed on m = 135 replicates (minimum, median, interquartile range, 1.5 IQR away from 75th percentile or maximum). Gray line: diagonal, colored line: local regression.

