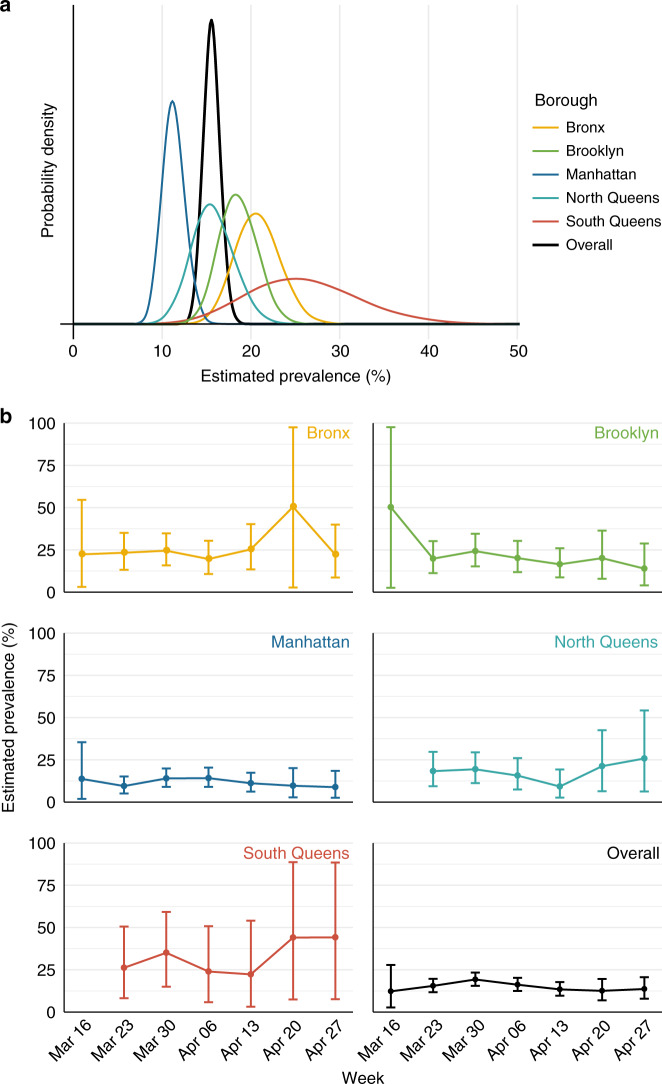
Fig. 1. Posterior prevalence of SARS-CoV-2 infection by New York City borough.
a Posterior distribution of SARS-CoV-2 prevalence by borough (colors) and overall (black) across the study period. b Weekly mean posterior prevalence of SARS-CoV-2 infection by borough with 95% credible intervals. For both panels, the test was assumed to have perfect specificity and 90% sensitivity. There were no recorded SARS-CoV-2 tests from patients with Queens ZIP codes during the week of 16 March. Source data, including sample sizes by week and borough, are listed in Supplementary Table 3 and provided as a Source Data file.

