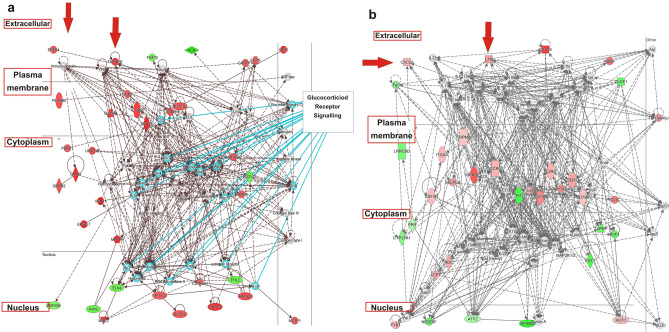
Figure 2.
Network analysis in active and chronic lesions. Networks were algorithmically constructed by IPA software on the basis of the functional and biological connectivity of genes. The network is graphically represented as nodes (genes) and edges (the biological relationship between genes). Red- and green-shaded nodes represent up- and downregulated genes, respectively; others (empty nodes) are those that IPA automatically includes because they are biologically linked to our genes based on the evidence in the literature genes have been placed automatically by IPA in different cellular compartments from nucleus to extracellular space: (A) the top ranked network for active renal lesions in IgAN shows a high degree of interconnectivity between genes (score 63, n.35 associated genes); (B) the top ranked network for chronic renal lesions in IgAN shows a great connectivity between genes (score 56, n = 33 associated genes).

