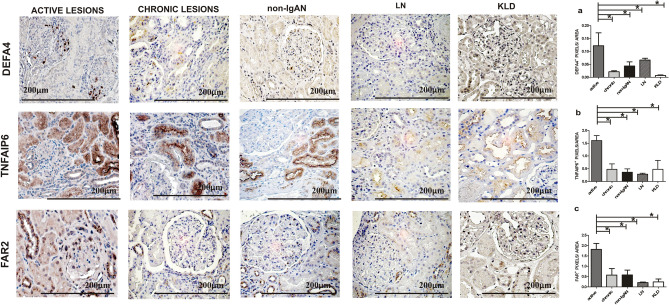
Figure 4.
DEFA4, TNFAIP6 and FAR2 protein expression levels in IgAN with active renal lesions. (A) Immunohistochemical analysis for DEFA4 shows a positive glomerular expression compared to other groups (n = 4 active group; n = 4 chronic; n = 4 non IgAN; n = 6 LN; n = 4 KLD). Kruskal–Wallis test p = 0.0131. Dunn’s multiple comparison test, active versus chronic, active versus non-IgAN, active versus LN and active versus KLD, all p < 0.05. (B) A strong TNFAIP6 expression has been found in the active lesion group compared to the other groups (n = 6 active group; n = 4 chronic; n = 4 non IgAN; n = 6 LN; n = 4 KLD). Kruskal–Wallis test p = 0.0216. Dunn’s multiple comparison test, active versus chronic, active versus non-IgAN, active versus LN and active versus KLD, all p < 0.05. (C) A strong FAR2 expression has been found in the active lesion group compared to the other groups (n = 4 active group; n = 4 chronic; n = 4 non IgAN; n = 6 LN; n = 4 KLD). Kruskal–Wallis test p = 0.0079. Dunn’s multiple comparison test, active versus chronic, active versus non-IgAN, active versus LN and active versus KLD, all p < 0.05. Magnification 40× .

