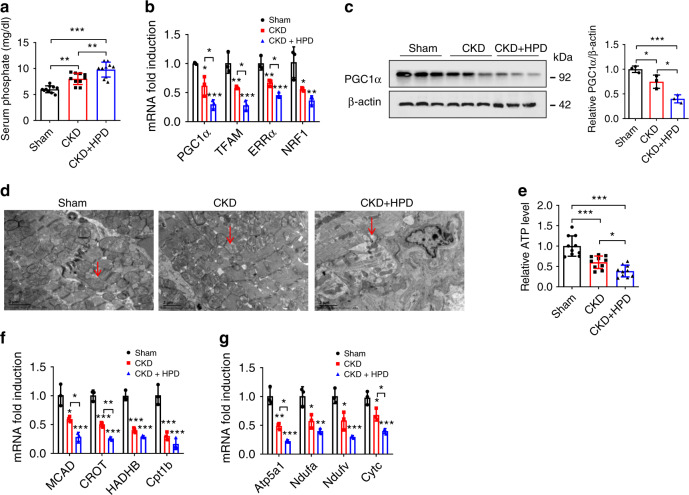
Fig. 3. HP induces PGC1α suppression and cardiac remodeling in CKD mice.
a Serum phosphate level in sham, CKD, and HPD-fed CKD mice for 12 weeks. n = 10 mice per group. b–g qPCR analysis of PGC1α and its target genes expressions (b), western blot analysis of PGC1α expression (c), representative images of TEM observation of mitochondria (d). Red arrows point to mitochondria, relative ATP level (e), relative mRNA expression of FAO genes (f), and relative mRNA expression of OXPHO genes (g) in heart tissues from the mice in a. n = 10 (a, e), or n = 3 (b–d, f, g). Data are shown as mean ± SD and were analyzed by one-way ANOVA. *P < 0.05, **P < 0.01, ***P < 0.001.

