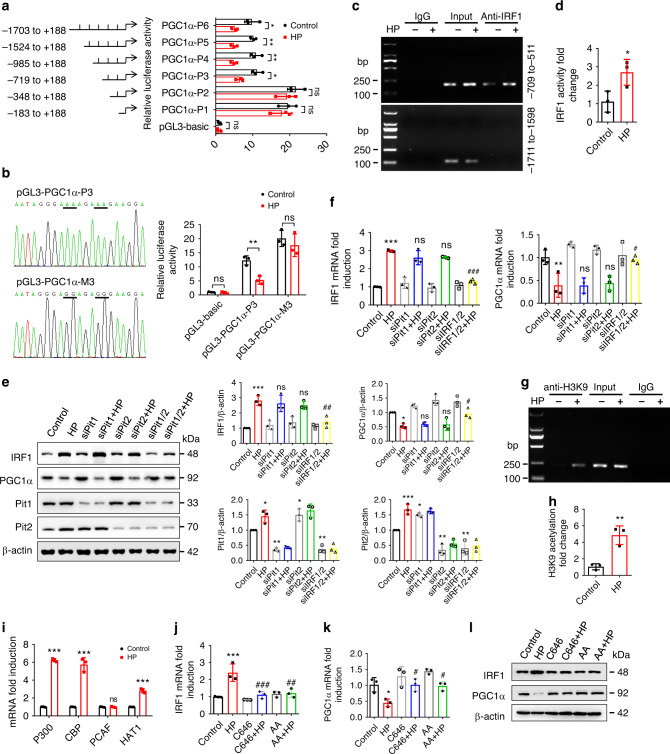
Fig. 6. IRF1 inhibits PGC1α expression via directly binding to its promoter region.
a After being co-transfected with pRL-TK vector and pGL3-basic or recombinant reporter plasmids containing various fragments of PGC1α promoter region, H9c2 cells were treated with control or HP and then harvested for dual-luciferase reporter assay. The firefly luciferase activity was normalized against Renilla activity. b H9c2 cells were co-transfected with pRL-TK vector and pGL3-PGC1α-P3 or pGL3-PGC1α-M3 (containing the mutant bases of pGL3-PGC1α-P3 underlined in the sequencing results), treated with control or HP and harvested for luciferase assay. c, d H9c2 cells were treated with control or HP for 24 h and harvested for ChIP assay. IRF1 antibody was immunoprecipitated with chromatin DNA fragments, taking IgG as a negative control. The precipitated DNA was amplified by PCR c and qPCR d using primers that cover the PGC1α promoter region (−709 to −511), taking primers that cover the region (−1711 to −1598) as a negative control. e, f qPCR and representative western blot analysis of IRF1 and PGC1α expressions in cells treated with siPit1, siPit2, or both in the presence or absence of HP. g, h H9c2 cells were treated with control or HP, and H3K9 acetylation was assayed using ChIP. i qPCR analysis of histone acetyltransferase genes expression in H9c2 cells treated with control or HP. j–l qPCR and western blot analysis of IRF1 and PGC1α expressions in cells treated with a P300/CBP inhibitor (C646, 10 μM) or a pan-histone acetyltransferase inhibitor (anacardic acid, AA,10 μM) in the presence or absence of HP. Data are shown as mean ± SD and were analyzed by a two-tailed unpaired t-test (a–d, h, i) or one-way ANOVA (e, f, j, k). n = 3 biologically independent experiments (a, b, d–f, h–k). *P < 0.05, **P < 0.01, ***P < 0.001 versus control. #P < 0.05, ##P < 0.01, ###P < 0.001, ns: no significance versus HP.

