
FIGURE 2.
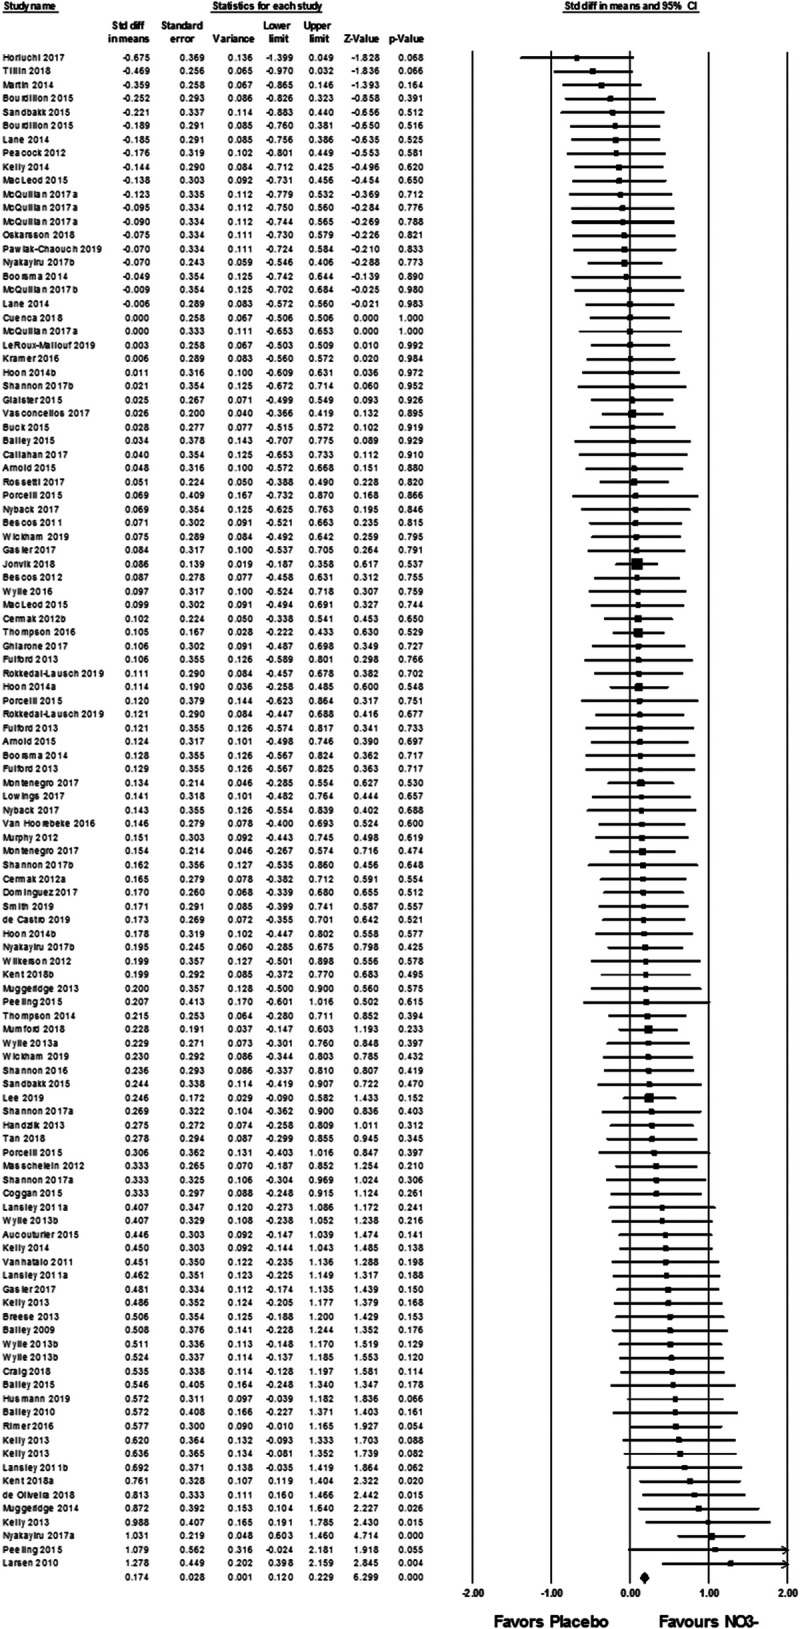
Forest plot displaying random-effects meta-analysis of exercise performance after placebo or NO3− supplementation. The vertical line represents the mean overall effect. Symbol size reflects weight of the effect for each individual study. Symbols on the left of the continuous black line at 0 show better exercise performance after placebo supplementation, whereas studies on the right of the black line demonstrate better exercise performance after NO3− supplementation.