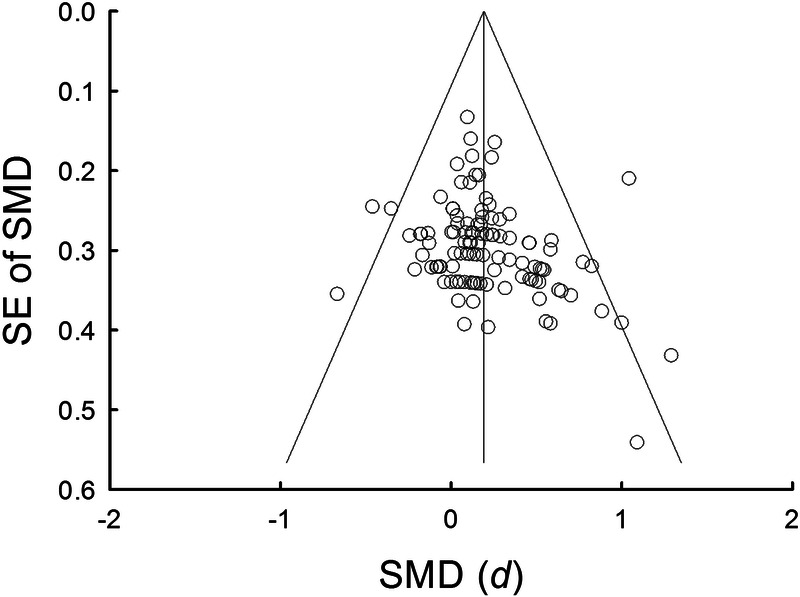
FIGURE 6.

Funnel plot of the SE and standardized effect for each study. The angled lines define the area including the 95% CI of the SMD, and the vertical line defines the middle of the funnel at the mean SMD. Visual inspection of the funnel plot shows that three studies fall below 95% CI and three studies are above 95% CI.
