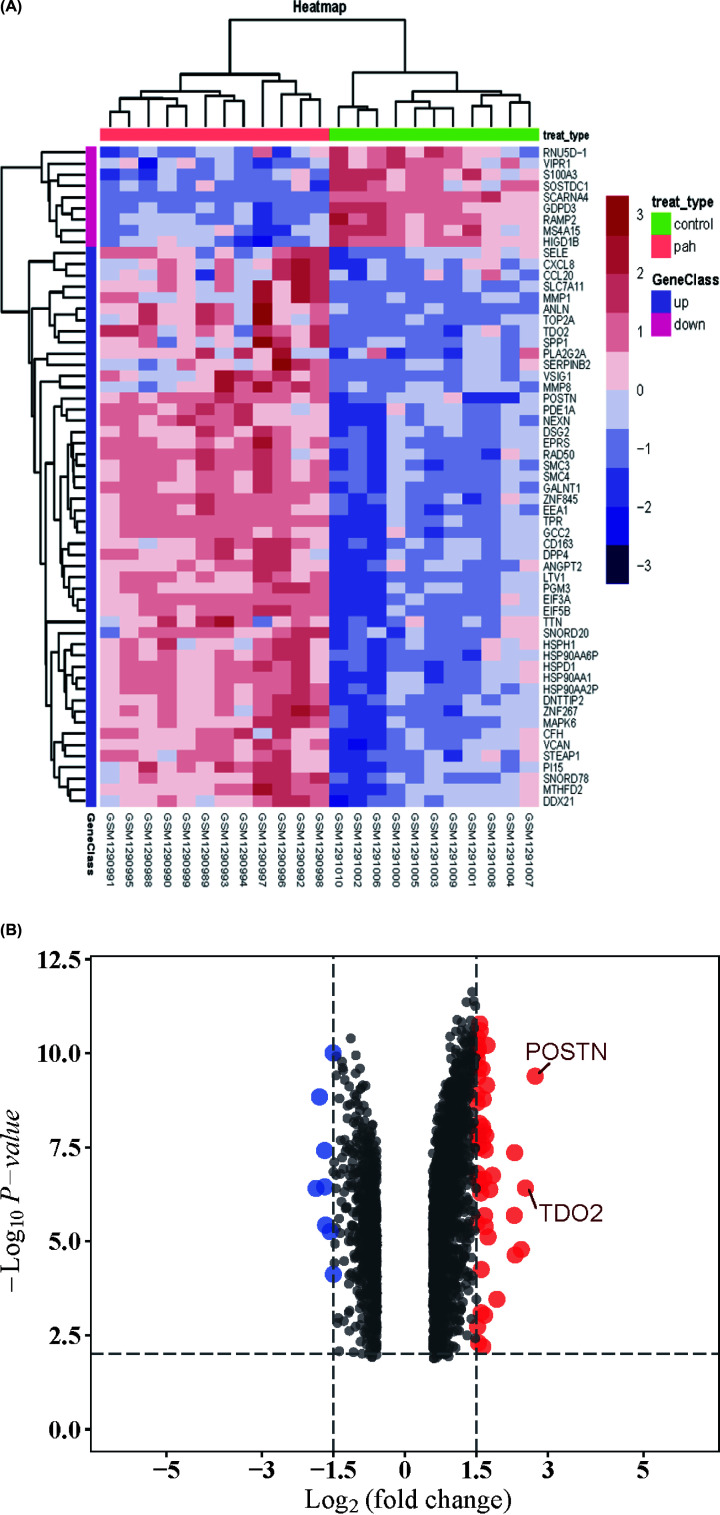
Figure 2. Heatmap and volcano plot of DEGs.
(A) Heatmap of 150 DEGs screened by limma package. Red areas represent highly expressed genes and green areas represent lowly expressed genes involved in PAH patients compared with healthy controls. (B) Volcano plot analysis and heatmap cluster of DEGs. Red dots represent up-regulated genes and green dots represent down-regulated genes in PAH patients compared with normal controls. Moreover, genes which log2FC>2 were marked; DEG, differentially expressed gene; PAH, pulmonary arterial hypertension.

