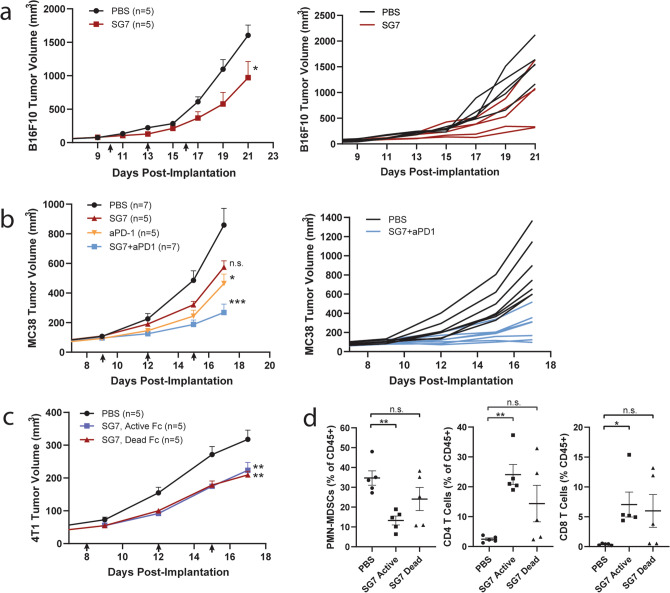
Figure 5.
VISTA blockade with SG7 slows tumor growth in multiple syngeneic mouse models. (a) B16F10 tumor-bearing C57BL/6 mice were treated with 10 mg/kg SG7 (dead Fc; mIgG2a-LALA/PG) bi-weekly, starting on day 10 (red arrows). n = 5 mice per group; mean tumor volume of each group (left) and individual tumor growth curves (right). All mice were euthanized on Day 21 due to volume and ulceration of untreated tumors. These data are representative of two independent experiments. Mean + SEM are shown. (b) MC38 tumor-bearing C57BL/6 mice were treated with 30 mg/kg SG7 (dead Fc) and/or 5 mg/kg anti-PD1, starting on day 9 (black arrows); n = 7 mice per group; mean tumor volume of each group (left) and individual tumor growth curves (right); all mice were euthanized on Day 17 due to volume and ulceration of untreated tumors. These data are representative of two independent experiments. Mean + SEM are shown. (c) 4T1 tumor-bearing BALB/c mice were treated with 30 mg/kg SG7 (active Fc; mIgG2a) or 30 mg/kg SG7 (dead Fc) bi-weekly, starting on day 8 (black arrows). n = 5–7 mice per group as indicated. All mice were euthanized on Day 17 for tumor extraction. Mean + SEM are shown. P-values in a–c calculated by repeated measures two-way ANOVA (Tukey’s), asterisks denote significant difference from PBS (untreated), *p < 0.05, **p < 0.005, (d) Immune flow analysis of extracted 4T1 tumors on Day 17. The percentage of PMN-MDSCs, CD4 + T cells and CD8 + T cells out of total CD45 + cells in each tumor sample are shown. Mean ± SEM are shown. P-values calculated by one-way ANOVA (DMCT), *p < 0.05, **p < 0.005.

