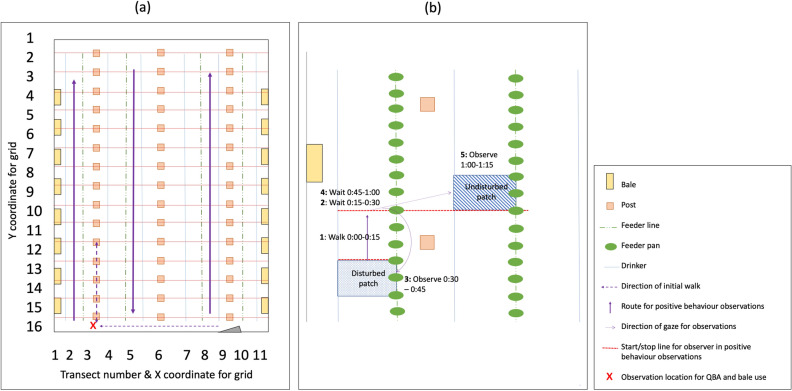
Figure 7.
(a) Layout of each house, showing theoretical grid for determining random areas of the house (X and Y axis), transect numbers (X axis), initial observation route and location, and Positive behaviour observations route and (b) Positive behaviour observations schedule (minutes) and methodology showing Disturbed and Undisturbed patches defined by the edges of the feeder/drinker lines and between 3 feeder pans. Figure created in Microsoft PowerPoint for Mac 2020 Version 16.40 (www.microsoft.com).

