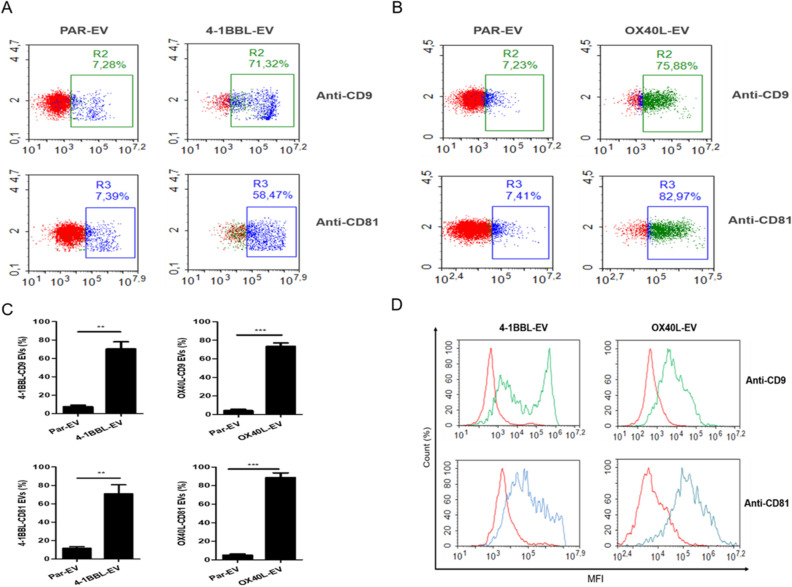
Figure 3.
Extracellular vesicles derived from genetically modified tumor cells expressing 4-1BBL or OX40L harbor respective ligands on the surface. We developed a flow cytometry assay in which EVs are captured using polystyrene beads coupled to anti-4-1BBL or anti-OX40L. The EVs bound to beads were subsequently stained for tetraspanins markers CD9 and CD81. (A) Dot plot for flow cytometry assay with 41BBL-EVs. (B) Dot plot for flow cytometry assay with OX40L-EVs. For all dot plots y-axis is the SSC, and x-axis is FITC intensity for CD9-FITC or APC intensity for CD81-APC. (C) Graphic representation of positive EVs for 4-1BBL-CD9, 4-1BBL-CD81, OX40L-CD9 and OX40L-CD81. The bars represent the mean ± SD of three independent experiments. The T test was performed (**p < 0.005; ***p < 0.0001). (D) Flow cytometry histogram shows 41BB-EVs and OX40L-EVs. The y-axis represents the percentage of cell numbers and the x-axis is the mean fluorescence intensity (MFI) on a logarithmic scale. Red curves represent parental-EVs used as a control, green curves are EVs preparations positives for CD9 and blue curves are EVs preparations positive for CD81. The figures are representative of three independent experiments.

