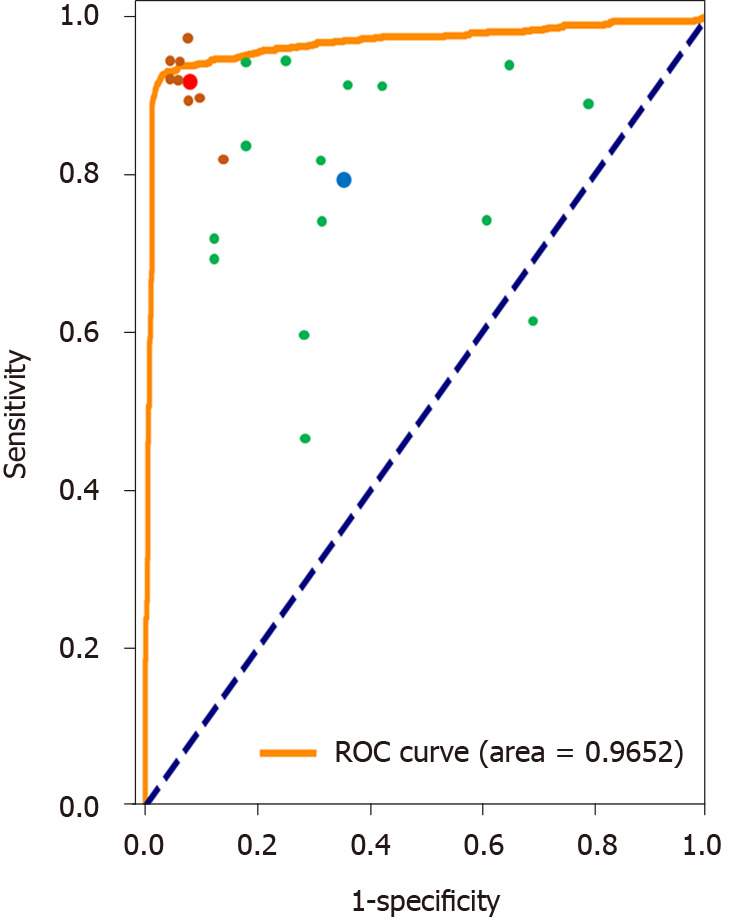
Figure 3.

Receiver operating characteristic curves and AUC values for the binary classification of the plain scan using the convolutional neural network model. Each trainee’s prediction is represented by a single green point. The blue point is the average prediction of them. Each gastroenterologist’s prediction is represented by a single brown point. The red point is the average prediction of them. ROC: Receiver operating characteristic.
