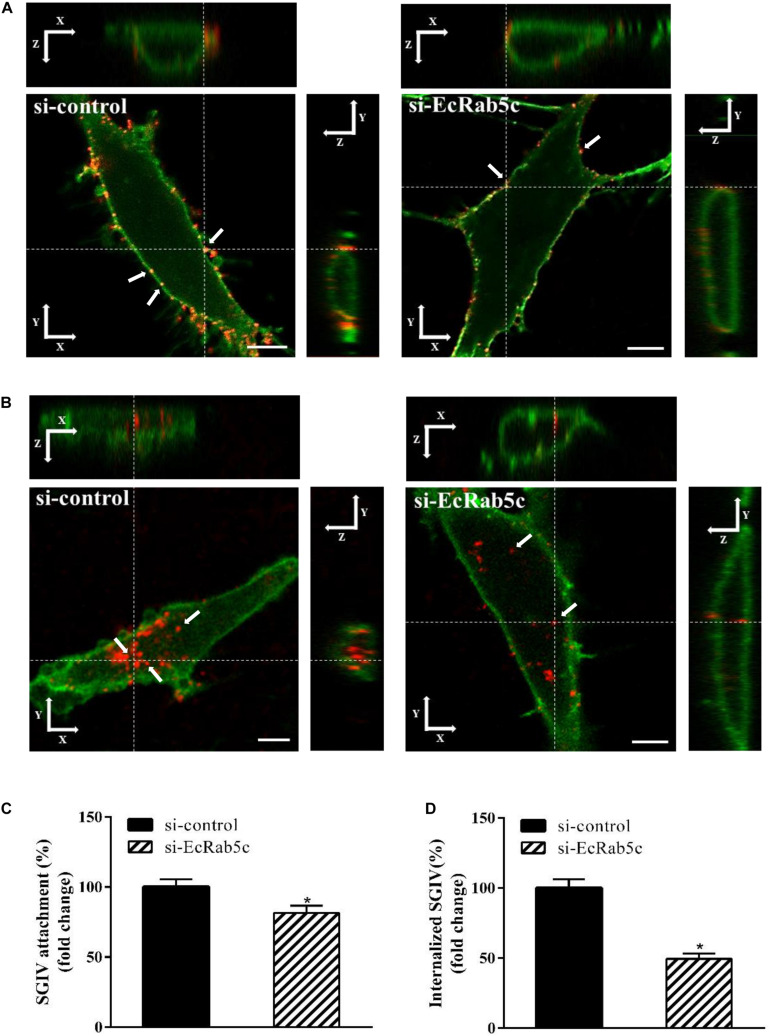
FIGURE 3.
Knockdown of EcRab5c by siRNA affects the attachment and entry of SGIV. (A) Three-dimensional (3D) confocal images of SGIV attachment in si-control or si-EcRab5c transfected cells. GS cells were transfected with si-control or si-EcRab5c, incubated with Alexa-Fluor 647 labeled SGIV (red) at 4° C for 1 h, and then fixed with paraformaldehyde. The cells were stained with DiO to show the cell membrane (green), and observed by confocal microscope. White arrow indicated SGIV particles. Scale bars shown as 5 μm. (B) 3D confocal images of SGIV internalization in si-control or si-EcRab5c transfected cells. After transfection with si-control or si-EcRab5c, GS cells were incubated with Alex-Fluor 647 labeled SGIV (red) at 4° C for 20 min, and then the temperature was transferred to 28° C to initiate infection. The cells were fixed at 1 hpi. The samples were stained with DiO to indicate the cell boundaries (green). White arrow indicated SGIV particles. Scale bars represent 5 μm. (C) Quantification of SGIV particle binding on the cell membrane. More than 90 cells were randomly selected and analyzed by MATLAB program. The SGIV attachment was quantified as the percentage of virus particles binding on the cell membrane in si-EcRab5c transfected cells relative to that in si-control transfected cells. The value in control cells was arbitrarily set as 100%. The data are indicated as the means ± SEM. *p < 0.05. (D) Quantification of internalized SGIV particles. Over 90 cells were randomly selected and analyzed by MATLAB program. The SGIV uptake was quantified as the percentage of internalized virus particles in si-EcRab5c transfected cells relative to that in si-control transfected cells. The value in control cells was arbitrarily set as 100%. The data are indicated as the means ± SEM. *p < 0.05.

