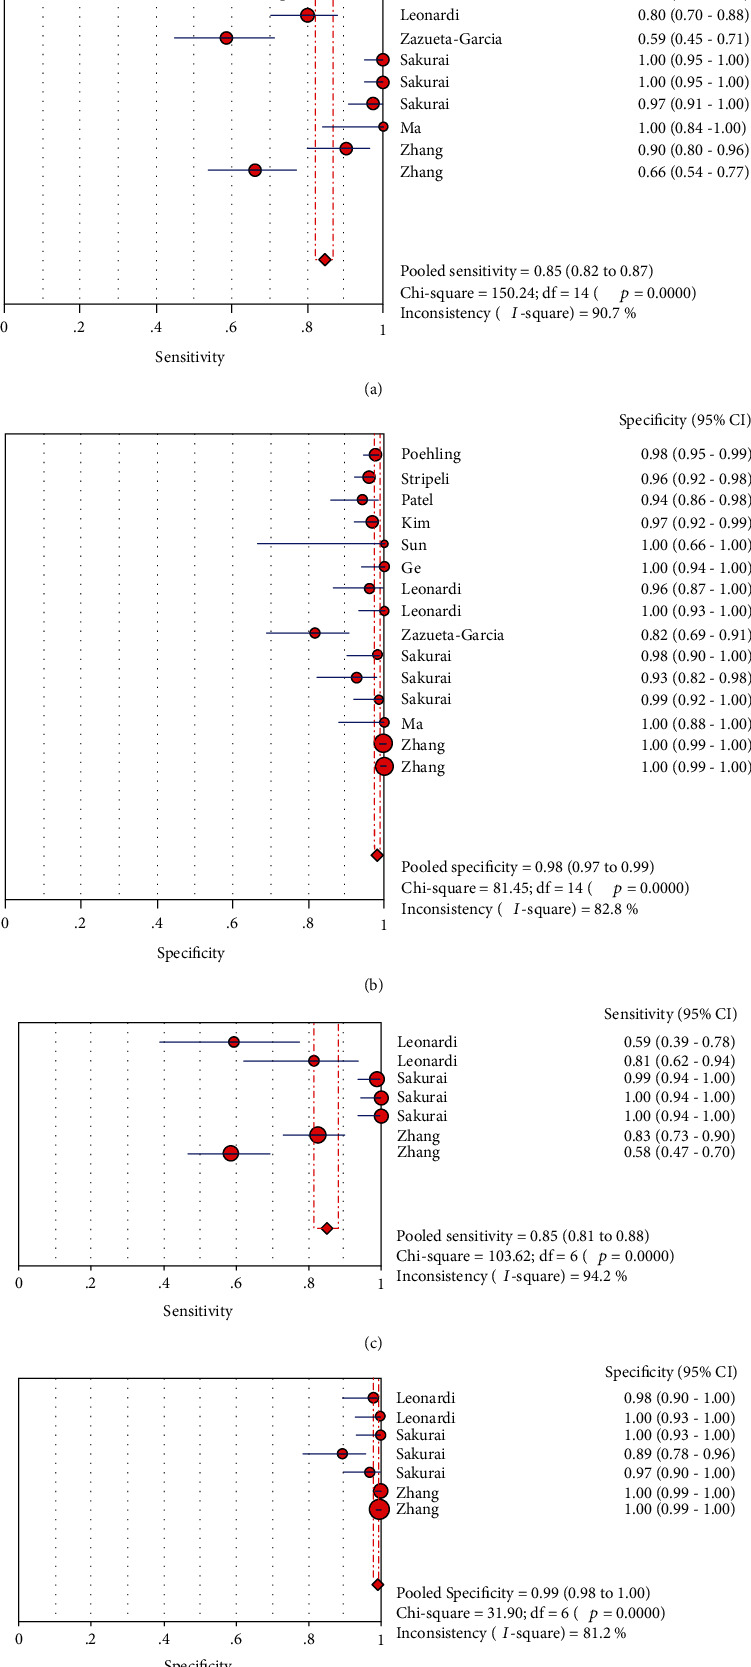
Figure 8.

Forest plots for sensitivity and specificity of two types of influenza viruses: (a) forest plots for the pooled sensitivity of influenza virus A; (b) forest plots for the pooled specificity of influenza virus A; (c) forest plots for the pooled sensitivity of influenza virus B; (d) forest plots for the pooled specificity of influenza virus B.
