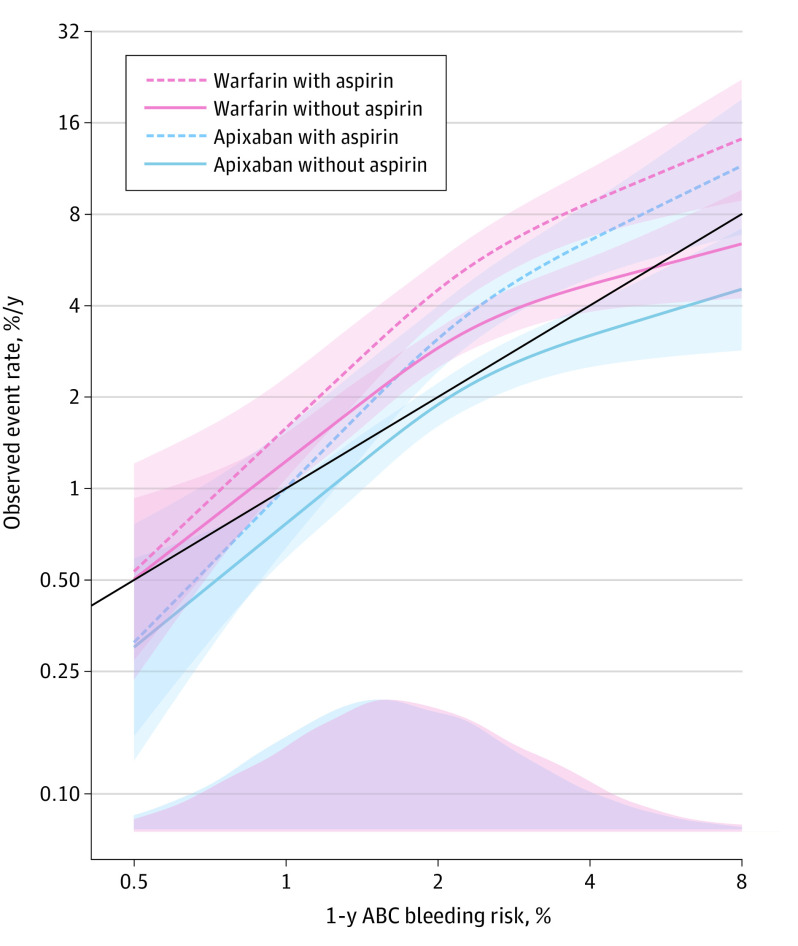
Figure 2. One-Year Risk of Major Bleeding Rate as a Function of the ABC (Age, Biomarkers, and Clinical History)–Bleeding Score by Different Treatment Combinations.
Lines denote hazard ratios. Shaded areas denote 95% CIs. The solid black line indicates perfect calibration. The bottom of the graph shows the distribution of the patients with ABC-bleeding risk scores as a density plot for each group at baseline.

