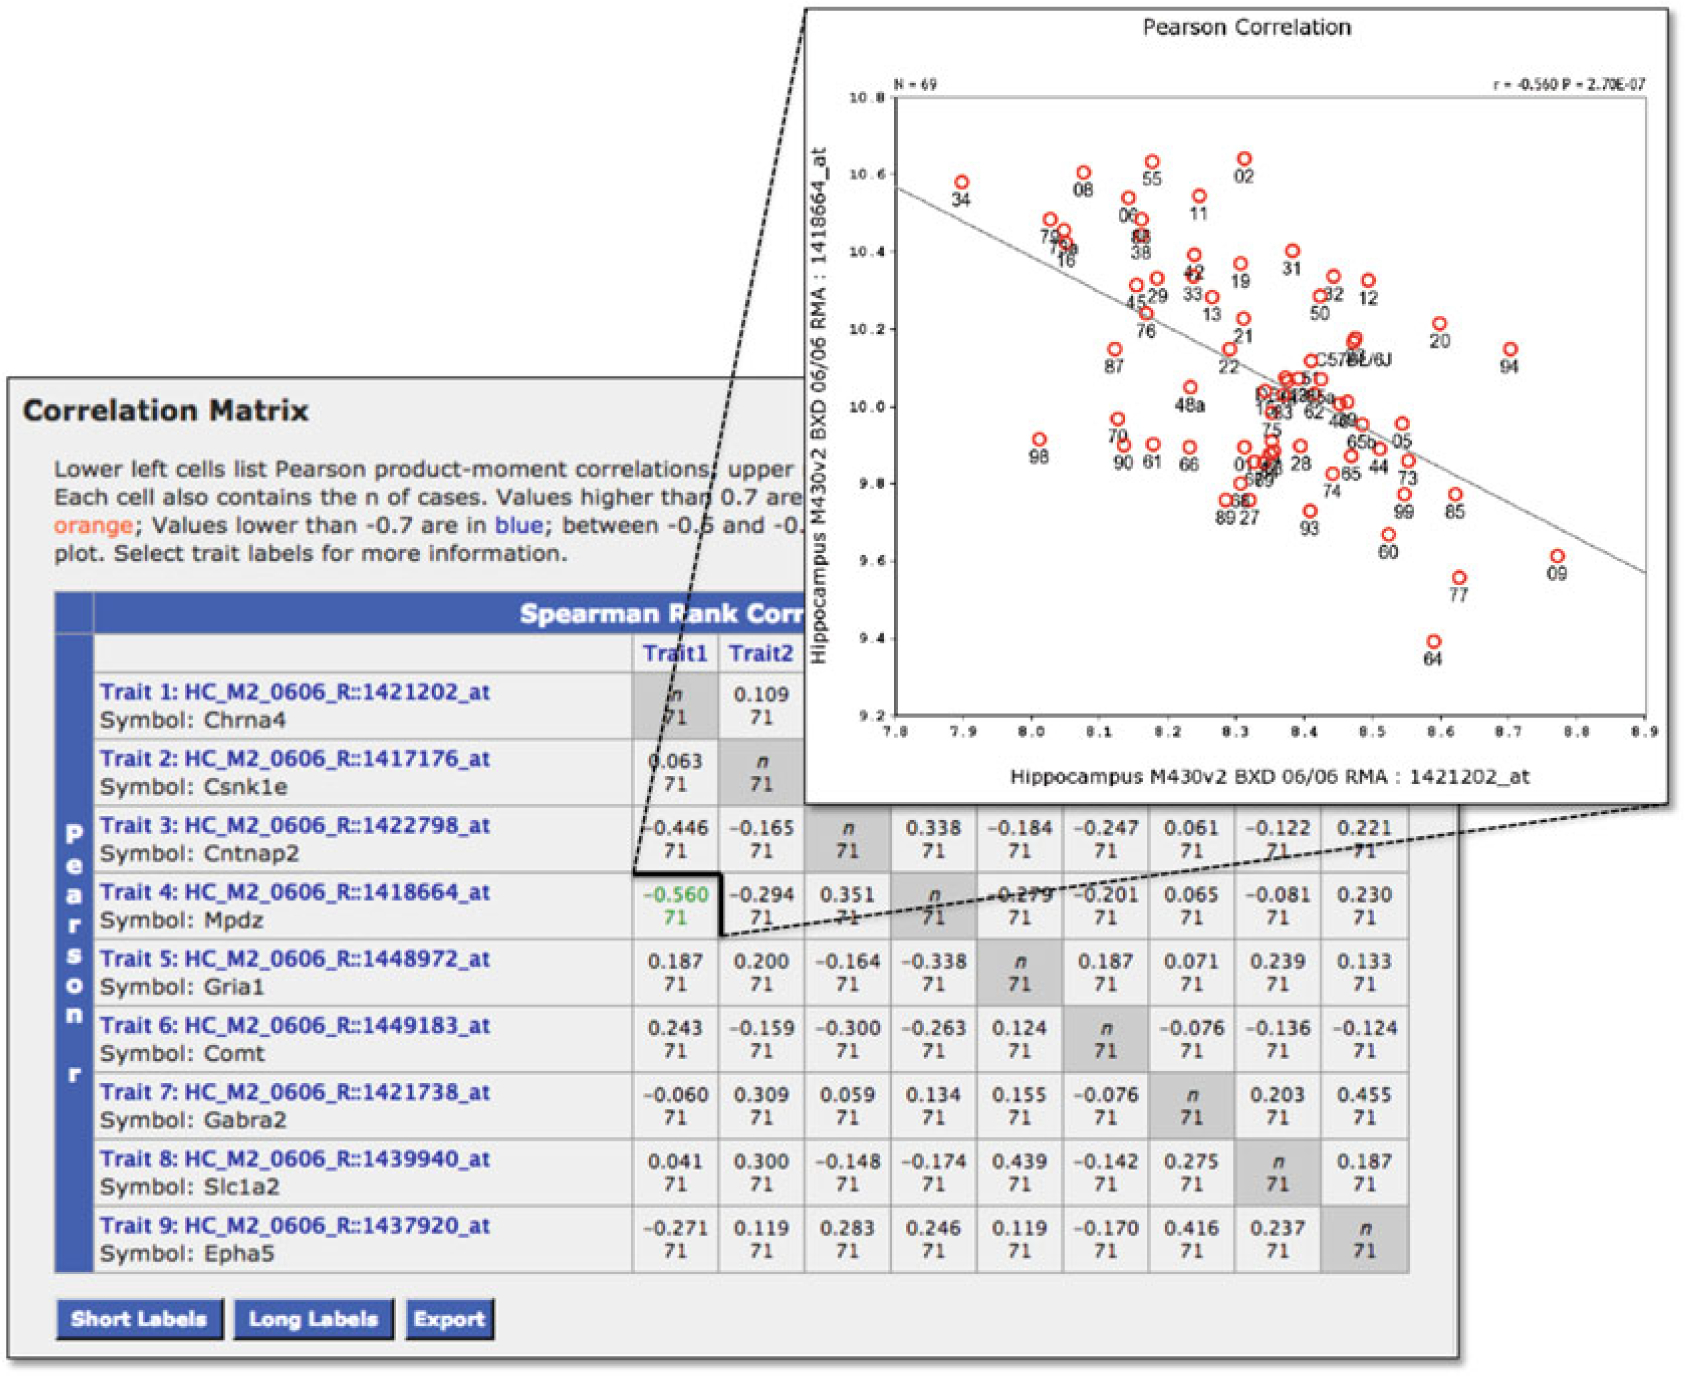
Fig. 11.

Exploring covariation. The matrix function allows users to investigate covariation between genes (or probe sets) in the Trait Collection. To display the gene symbols along with the probe set IDs, use the Short Labels button to redraw the correlation matrix. The matrix displays the correlation for each pair of genes (or probe sets) with the spearman correlation coeffi cient shown to the right of the diagonal and the Pearson Correlation Coeffi cient shown to the left (the diagonal is indicated by grey shading and would normally be represented as a 1, or the correlation of each probe set with itself). Scatterplots can be generated by clicking the correlation in the matrix. The scatterplot can be customized by selecting the Show Options icon, adjusting the settings, and replotting
