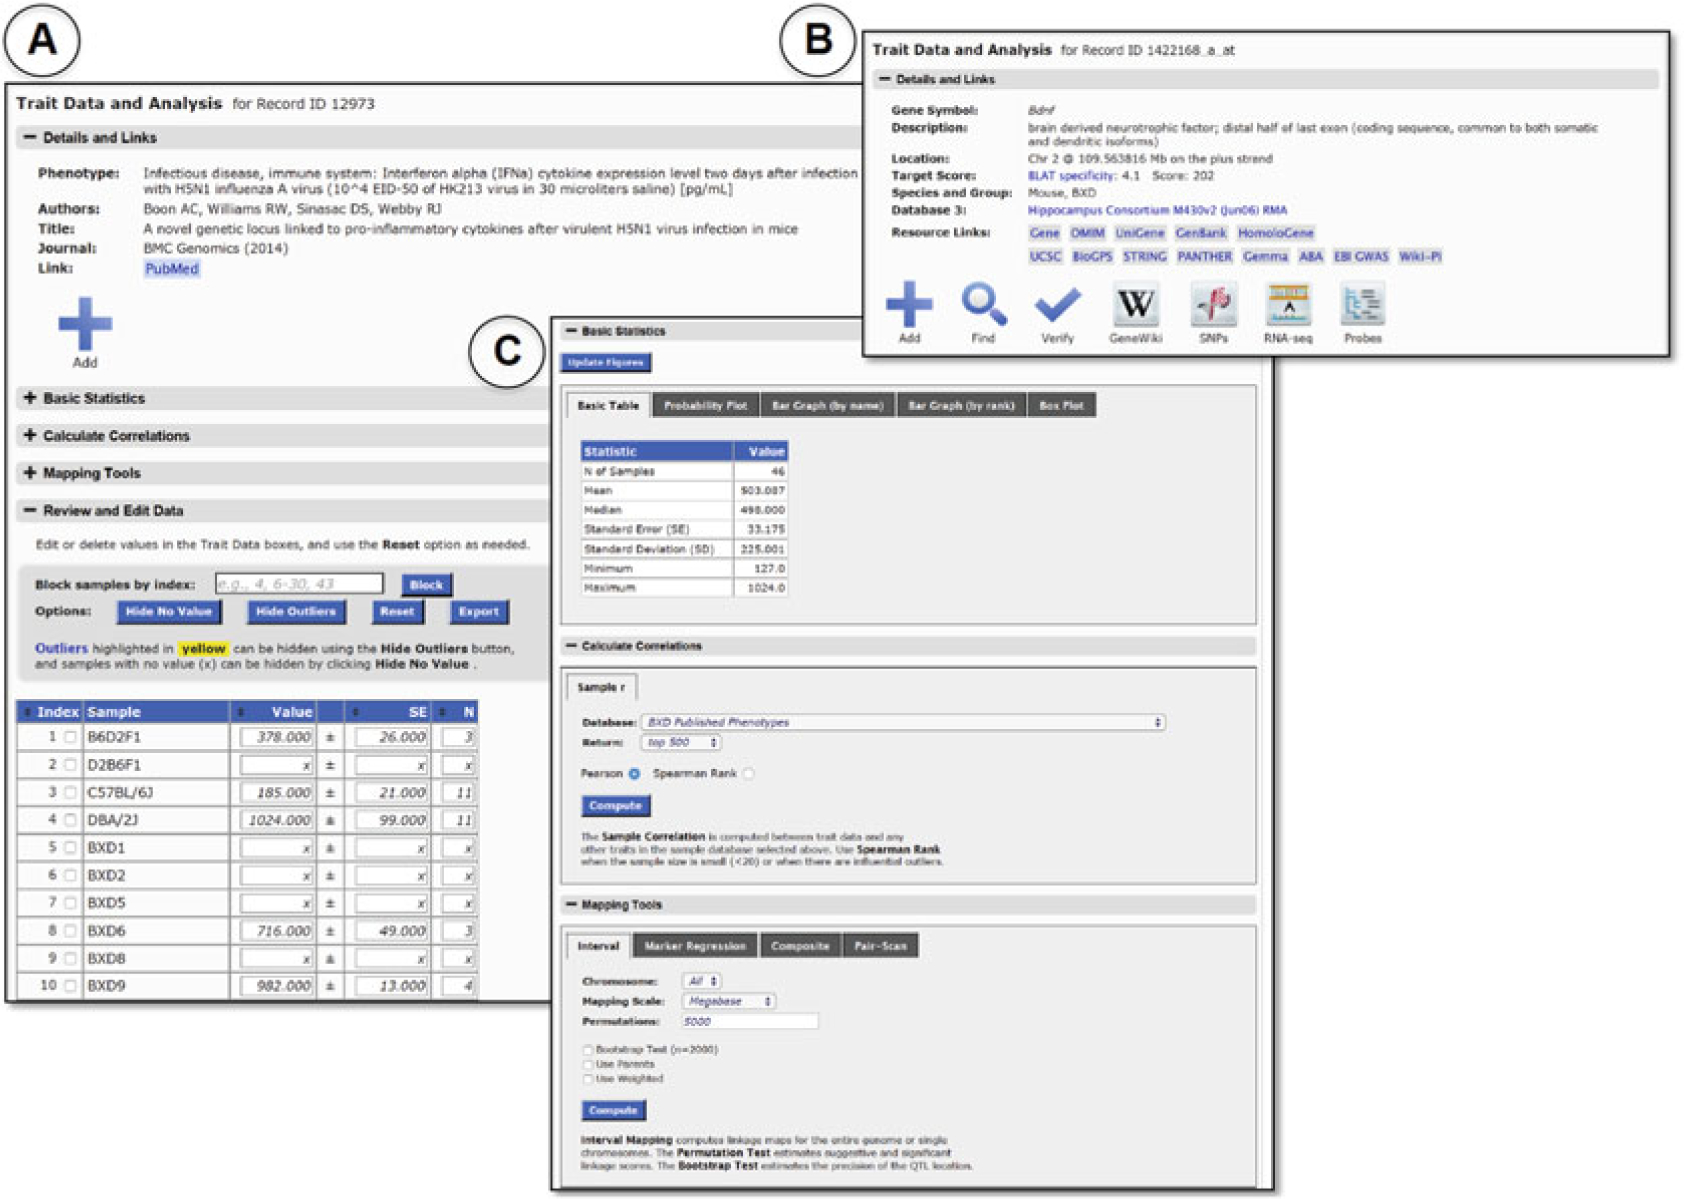
Fig. 6.

Layout of Trait Data and Analysis page. Users can explore individual traits in detail in the Trait Data and Analysis page. In the Details and Links track, a full description of the trait and associated actions and tools are shown. Actions and tools vary slightly depending on whether the trait is from a phenotype (A) or gene expression (B) Data Set. The results in B can be generated by selecting Mouse (Species), BXD (Group), Hippocampus mRNA (Type), Hippocampus Consortium M430v2 (Jun06) RMA (Data Set) and entering the gene symbol “ Bdnf ” using the Get Any option. Multiple links to outside resources (shown as Resource Links) are provided for gene expression data in addition to the GeneNetwork actions and tools Add, Find, Verify, GeneWiki, SNPs, RNA-seq, and Probes. Both traits have a common set of tools shown in Panel C as the Basic Statistics, Calculate, Correlations, and Mapping Tools tracks. Each track gives the user options to graph the trait distribution, correlate expression of the trait with all other traits in a Data Set from the same Group, or perform QTL mapping for the trait, respectively. Actual trait values are shown in the Review and Edit Data track
