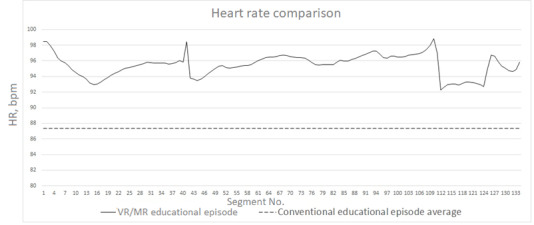
Figure 3.

Representative heart rate segment plot for the VR/MR educational episode. Dashed line denotes the baseline established in the first experimental session. HR: heart rate; MR: mixed reality; VR: virtual reality.

Representative heart rate segment plot for the VR/MR educational episode. Dashed line denotes the baseline established in the first experimental session. HR: heart rate; MR: mixed reality; VR: virtual reality.