
Figure 3.
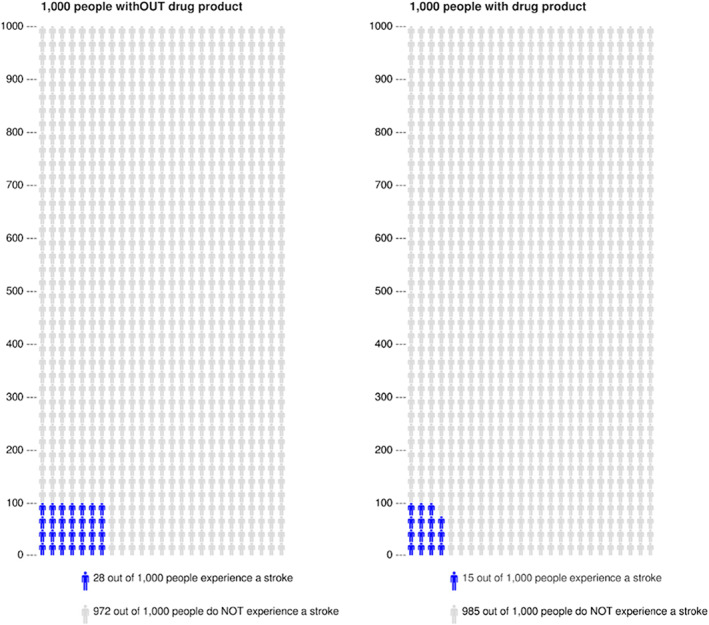
Examples of icon‐arrays communicating the baseline risk of a stroke for a defined population of 1,000 people without drug product (left) compared to 1,000 people taking an imaginary drug product aimed at reducing this risk (right). Potential side effects are omitted in this example but may also be included using another colour. Icon‐arrays were generated using http://www.iconarray.com