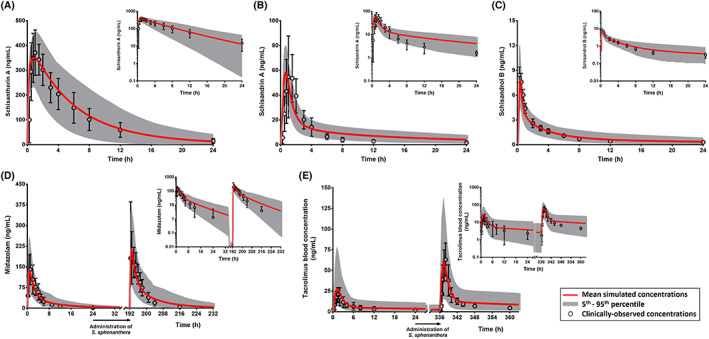
FIGURE 2.

Comparison of PBPK simulations and clinically‐observed concentrations of schisantherin A (A), schisandrin A (B) and schisandrol B (C). PBPK model prediction of interactions between Schisandra lignans and midazolam (D) and tacrolimus (E). Clinically‐observed data (mean concentrations with associated standard deviations) are overlaid on simulated pharmacokinetic profiles shown in linear scales with the corresponding semi‐logarithmic plots as insets. All clinical pharmacokinetic data were from studies in healthy Chinese people, except for schisandrol B which were from people of Korean ancestry
