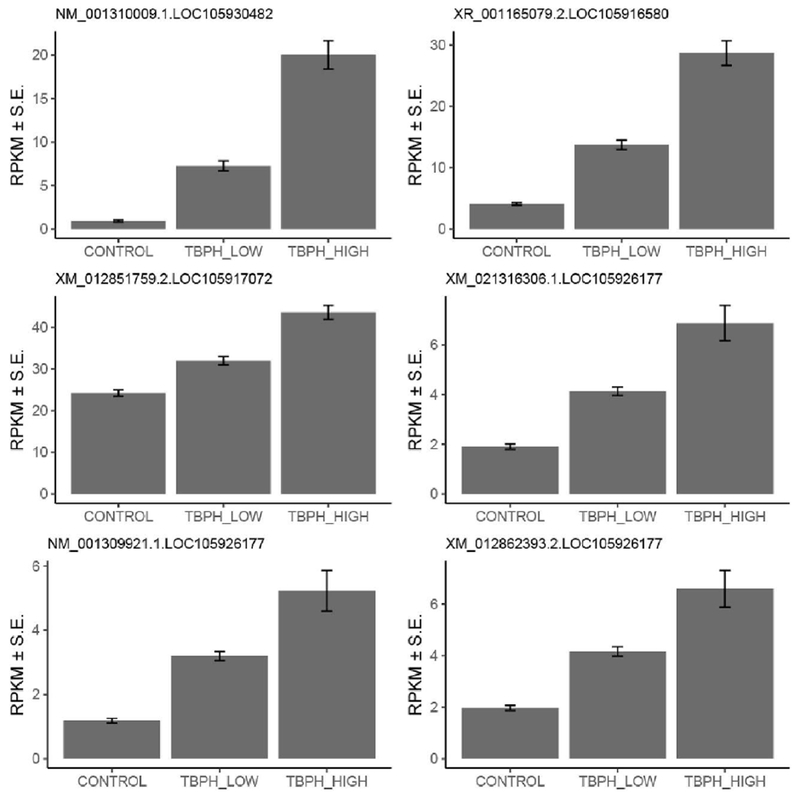
Fig. 1.

Dose-dependent expression of the top 6 significant transcripts among three groups. The six bar-plots show the mean expression level of the top 6 significant transcripts, one for each transcript as indicated by transcript ID at top-left of each plot. In each bar-plot, x-axis shows experimental groups and y-axis is mean expression level in RPKM (Reads Per Kilobase of transcript per Million mapped reads). The height of each box indicates estimated mean expression level and the corresponding error bar shows the 95% confidence interval of the mean estimate (mean ± standard error (S.E)). The mean expression of these six transcripts were statistically significant in both control-TBPH_LOW and control-TBPH_HIGH comparisons at the 5%.FDR cutoff.
